Categories
Original Research Articles

Skin cancer awareness in the Northern Rivers: the gender divide

Background: Australia has the highest incidence of skin cancer in the world. Despite decades of public health campaigns, these figures are rising, particularly within the male population.
Aim: This study aimed to establish whether a gender divide exists in relation to skin cancer awareness, prevention and early detection in a rural area of Australia where skin cancer rates are high.
Methods: Participants were recruited from two medical practices in the Northern Rivers region. Skin cancer awareness, knowledge and prevention were assessed through a qualitative questionnaire, with some questions having responses that used a modified Likert scale. Participant responses were scored for correctness and unpaired t-tests were used to compare scores between the genders.
Results: Females scored higher than males in all three domains assessed, including awareness, knowledge and prevention. Knowledge surrounding skin cancer awareness was significantly higher (p=0.03) in females compared to males. Similarly, the frequency at which females performed skin self-examinations was significantly higher (p= 0.04) than their male counterparts. Males were less likely than females to participate in a range of sun-protective behaviours, however, similar rates of sunscreen use were observed in both genders.
Conclusions: Overall, our study demonstrated that females from the Northern Rivers, NSW were more knowledgeable about skin cancer than their male counterparts and are more likely to participate in sun protective behaviours and secondary prevention strategies, including skin self-examinations and clinical skin examinations by a medical practitioner. These findings of a gender divide are supported by several international studies and can perhaps provide an explanation as to why a discrepancy exists between Australian males and females with regard to the increased incidence of skin cancer.

Introduction

Skin cancer awareness in the Northern Rivers: the gender divideAustralia has the highest incidence of skin cancer in the world, with two out of three Australians being diagnosed before the age of 70. [1] There are three types of skin cancer related to sun exposure: malignant melanoma (MM), basal cell carcinoma (BCC) and squamous cell carcinoma (SCC). Malignant melanoma is the least common but the most serious, accounting for 75% of skin cancer related deaths. [2] Early melanomas are usually highly visible and previous studies have shown that early detection of thin lesions is associated with a high five-year survival rate. [3, 4] BCC is the most common skin cancer in Australia, followed by SCC. [5] Although the non-melanoma skin cancers rarely result in mortality, they are very common and have the potential to recur, disfigure and metastasise if not identified and treated in a timely manner. [6, 7]

The epidemiological literature concerned with predisposing factors for skin cancer emphasises the considerable influence of ultraviolet (UV) radiation on the incidence of skin cancer. [8, 9] Primary prevention efforts are aimed at reducing the risk factors for skin cancer, most notably sun exposure and sunburn, through environmental changes, social changes and behavioural modification. [5] This includes diverse activities to minimise exposure to the sun, such as adopting sun protection strategies such as using sunscreen, wearing protective clothing and avoiding midday sun. [10 11]

Secondary prevention efforts to reduce skin cancer, including the early detection through systematic skin cancer screening and excision of early precancerous or cancerous lesions, have an important impact on the morbidity and mortality associated with skin cancer. [12] The 2003 SCREEN project (Skin Cancer Research to Provide Evidence for the Effectiveness of Screening) in Northern Germany demonstrates the feasibility and effectiveness of systematic skin cancer screening. Over a twelve-month period, physicians carried out 360,288 skin checks and consequently identified 3103 melanomas resulting in a 34% increase in melanoma incidence for the year of the study. Five years after SCREEN, melanoma mortality was reduced by over 50%. [13] Northern Germany has a low skin cancer prevalence compared to Australia, thus the anticipated benefits of systematic skin cancer screening are likely to be even greater in Australia.

Current Australian clinical guidelines do not recommend systematic skin cancer screening, however, the Australasian College of Dermatologists recommends annual skin checks by a physician in individuals who are at an increased risk of developing skin cancer. [14] Risk factors for skin cancer include host factors such as Fitzpatrick skin types I and II, multiple melanocytic naevi or dysplastic naevi and melanoma in a first degree relative. [15] Environmental risk factors include excessive UV exposure and frequent sunburns, particularly from a young age. In addition to annual screening of high-risk groups, it is recommended that the general population perform whole body skin self-examinations (SSE) at least four times a year. [14] Previous surveys on the practice of SSE in Australia have indicated varying results, ranging from 6-60% of the population practising some kind of SSE depending on the population studied. [16] A survey of Queensland residents found that the rates of SSE were higher among females compared to males and there was an increased likelihood of SSE in individuals with a higher level of education. [17]

It has long been known that UV radiation is a significant factor in the development of skin cancer. As a result of this well documented link, the Australian government has launched numerous public health campaigns since the 1980’s. [18] These sun safe media campaigns, including the well-known ‘slip, slop, slap’ campaign, aimed to increase community awareness. Despite these campaigns, the incidence of skin cancer in Australia has risen steadily over the past two decades. This rise can be partly explained by the increased diagnosis of small SCC’s and BCC’s that have previously remained untreated, however, it cannot solely be responsible for the increase in incidence.

A study by Staples et al (2006), found that rates of BCC and SCC increased from 1985 to 2006, with 70% of men and 58% of women aged over 70 years having at least one skin cancer at the later time point. [19] Further, research into the cause of this increase identified that the rates of skin cancer in males may be the primary contributor to the rise. [19, 20] Skin Cancer Australia found that the incidence of melanoma in males has risen by 100% over the last 20 years. [20] The exact cause of this increase in Australia is unclear.

It has traditionally been assumed that men have higher rates of skin cancer primarily because they are more likely than women to have outdoor jobs, which involve extensive sun exposure. This may be only one of the factors contributing to their higher risk. A recent American skin cancer foundation survey revealed that men are less likely than women to make an effort to protect themselves from the sun and are less knowledgeable when it comes to skin cancer prevention, awareness and early detection. [20] Furthermore, a qualitative study, which assessed skin cancer awareness, attitudes and sun protection behaviour among medical students at the University of Miami, Florida, found significant gender differences in sun protection and skin cancer knowledge. More women than men valued the importance of sun protection and acknowledged that sun exposure is the most important risk factor for skin cancer. [21]

A gap exists in the literature as to whether a similar gender divide is present in Australia, which could possibly explain the increased rates of skin cancers seen in the male population. Through the use of a qualitative questionnaire, this study aimed to:

  1. Establish whether a gender divide in relation to skin cancer knowledge and prevention exists in the Northern Rivers region of NSW, an area close to the Queensland border, where the highest rates of skin cancer in Australia have been reported. [22]
  2. Use these results as the basis for further studies that can better inform medical practice in relation to skin cancer awareness and prevention.

Methods

Participants and Study Design:

Participants were recruited through information posters placed in the waiting rooms of two medical practices in the Northern Rivers region: the Goonellebah Medical Centre and the Lennox Head Medical Practice. Participation in the project was voluntary and anonymous, with participants returning the completed questionnaires to a secured box placed in the waiting room. There were no exclusion criteria other than participants needing to be aged 18 years or over. The study ran between December 2012 and February 2013 inclusive.

All participants completed the qualitative questionnaire, which was largely adapted from the Department of Health and Aging – Evaluation of National Skin Cancer Awareness Campaign [23] and previous UOW research. [24] Questions were constructed in such a way as to assess knowledge and attitudes towards skin cancer awareness, prevention and early detection. The questionnaire included questions on a modified Likert scale which were adapted from a previous study. [24] Demographic information including gender, age and level of education was also collected.

Ethics:

This study received approval by the Human Research Ethics Committee (HREC) of the University of Wollongong, Australia (Ethics number: GSM12/055).

Statistical analysis:

Descriptive statistical analyses were performed to establish the distribution of participants’ characteristics. Responses either used a modified Likert scale or were scored for correctness (Appendix 1). Analyses of patients’ sun protection practices, skin cancer awareness, skin cancer knowledge, frequency of skin self-examination and skin examination with a medical practitioner were completed using EXCEL, Microsoft (Redmond, Washington, U.S) software for Windows. Recorded information was then further analysed to establish whether responses varied between genders. Sample sizes for each analysis varied slightly due to incomplete questionnaires. Analysis was performed using unpaired t-tests, with the level of significance set at p=0.05.

Results

Demographics:

In total, 91 patients from the two medical practices completed the questionnaire. There was an approximate 1.3:1 female to male ratio with a high representation of the older 55+ years age group. The age distributions of participants are shown in table 1. There is a sizeable difference in age distribution between males and females. This is largely due to the patient population seen at both medical practices. Level of education was relatively evenly distributed with 61% of females having tertiary education and 39% having secondary education compared to 58% and 42% respectively, for males.

Table 1: Age distribution of participants.
Figure 1. Compares the awareness of skin cancer prevalence in Australia between males and females.
Figure 2. Perceptions of types of skin cancers between males and females.

Skin cancer knowledge:

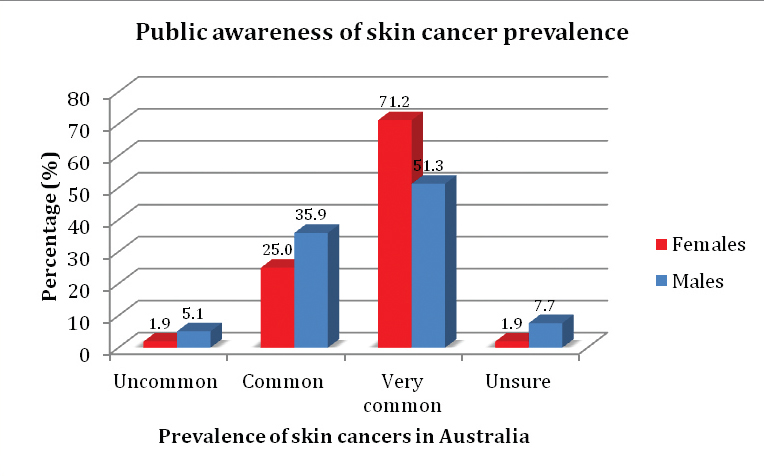
Skin cancer knowledge was assessed through three primary domains; awareness of prevalence of skin cancer within Australia (Figure 1), knowledge surrounding types of skin cancers (Figure 2) and awareness of sunburn as a primary contributory factor for the development of skin cancer (Figure 3). Females scored significantly higher in relation to prevalence of skin cancer, and sunburn risk compared with males (Table 2). The percentage of females who correctly identified key elements in the three domains was higher than males for skin cancer prevalence (71% females; 51% males), awareness of skin cancer types – SCC (71% females; 50% males) and melanoma (77% females; 52% males), as well as sunburn as a primary contributing factor (92% females; 76% males). The percentage of males and females who correctly identified BCC as a type of skin cancer was similar (88% females; 90% males).

Table 2: Comparison of skin cancer knowledge between males and females. * = Significant males vs. females, p < 0.05, unpaired students t-test
Table 2: Comparison of skin cancer knowledge between males and females. * = Significant males vs. females, p < 0.05, unpaired students t-test[/caption] Skin cancer prevention:

Reported sun protective behaviours are shown in Figure 4. The most sizeable gender differences were that more females reported using wide brimmed hats, actively seeking shade and using sunglasses. Overall, only a small percentage of participants reported not engaging in any form of sun protective behaviour (males 3%, females 2%).

Skin cancer early detection:

The frequencies of skin self-examinations are shown in Figure 5. Overall, the frequency at which females perform SSE was significantly higher than their male counterparts (p=0.04) when the response options were converted to a modified Likert scale of 0 – 3. Among females, 42% reported performing SSE frequently compared with 30% of males. The percentage of males who never (13%) or rarely (26%) performed a SSE was higher than females (8% and 6%, respectively).

The frequencies of skin examinations performed by a medical practitioner are shown in Figure 6. A substantial proportion of the male cohort (28%) reported to having never had their skin examined by a medical practitioner. This is higher than the corresponding female group (8%). Rates of reported examinations on a 6-12 month basis were much higher among the female population (38%) compared to the male population (18%). When these response options of frequency were converted to a modified Likert scale of 0-4, and compared using unpaired t-tests, there was no significant difference between males and females (p = 0.111).

Discussion

This population-based survey documents skin cancer knowledge, prevention and early detection in a Northern Rivers population (Northern NSW, Australia), an area close to the Queensland border, where skin cancer rates are high and rising rapidly particularly among the male population. The response rate obtained (n=91) was a satisfactory representation of gender (57% female, 43% male), but slightly weighted towards older age groups (>55 years). The predominantly elderly patient population seen at the two medical practices can explain this higher proportion of elderly participants.

In this population, females were significantly more knowledgeable than males in the identification of skin cancer prevalence (p=0.03) and were more likely to identify types of skin cancers, however, this difference was not significant (p=0.21). Despite Australia being a world leader in skin cancer incidence, only half (51%) of the male cohort compared to 71% of females correctly identified skin cancer incidence as being very common, occurring in 2 in 3 Australians. Given the higher prevalence of all skin cancer types within the male population , [20] this is an important finding as it suggests that perhaps skin cancer campaigns are not having as great of an impact on the male population in terms of education, and need to be more targeted in their approach.

[caption id="attachment_3960" align="aligncenter" width="300"]Figure 3. Awareness of sunburn as a key risk factor in the development of skin cancer. Figure 3. Awareness of sunburn as a key risk factor in the development of skin cancer.
Figure 4. Reported sun protective behaviours by males and females.
Figure 5. The frequency of self-skin examinations between males and females.
Figure 6. Frequency of skin examination performed by a medical practitioner.

A more perturbing finding was that males scored lower than females in relation to knowledge of the types of skin cancers that exist. Only half of the male cohort correctly identified melanoma (52%) and SCC (50%) as skin cancers, compared to 77% and 71% respectively of the female cohort. These results are alarming given that melanoma is the fourth most common cancer in Australia and its incidence in the male population is 2-fold higher than that observed in females. [22] Surprisingly, and contrary to the former findings, 90% of male participants correctly identified BCC as a type of skin cancer, similar to females (88%). The exact cause of the higher identification of BCC as a skin cancer is unknown, but may be attributed to the fact that BCC is the most common and prevalent skin cancer in Australia, and thus the male population may be more familiar with its presentation. [5] Interestingly, moles (37%), age spots (18%), freckles (13%) and acne (2%) were identified by a portion of the male population as types of skin cancers.

Despite demonstrating limited knowledge in terms of skin cancer incidence and types of skin cancers, the majority of the male cohort (76%) correctly identified excessive UV exposure and in particular recurrent sunburn as a key causative factor of skin cancer. This high response rate may be a reflection of the decades of public health campaigns the Australian public have been exposed to, which highlight the well-known link between sun exposure and skin cancer. Although the male score in this area was higher than that seen in the other two domains, it was still significantly lower (p=0.033) than that of the female cohort and once again demonstrated a gender divide concerning skin cancer knowledge.

Sunscreen was the most commonly used measure of sun protection by males with 57% of the male cohort reporting the use of SPF >30 sunscreen on a regular basis. This trend is in keeping with current literature, which reports that sunscreen is the most commonly used measure of sun protection in adults. [25] Stanton et al. report that females have a greater desire for a tan and have an increased perception that a tan is healthy and this translates into them using sunscreen at lower rates then the male population. [26] Our results demonstrate no such gender difference regarding this behaviour, and in fact our study demonstrates that females are more likely than males to participate in other sun protective behaviours such as wearing a wide brimmed hat, long sleeved shirt, actively seeking shade and wearing sunglasses. Overall, females were found to be more proactive when it comes to protecting themselves from the sun, however, on a whole, the level of sun protective behaviours in both cohorts were relatively low with just over half of the female population participating in some kind of sun protective behavior on a regular basis with lower rates seen in the male population. This finding is particularly relevant, as even though the majority of these participants were in their mid to late teens when the well known ‘slip, slop, slap’ campaign was launched, a large proportion of them are not necessarily adopting sun protective behaviours.

Secondary prevention strategies include clinical systematic skin examinations by a doctor and skin self-examinations. The current Australian clinical guidelines do not recommend clinical systematic skin examinations, however, due to the high incidence of skin cancer seen in Australia, the Australasian College of Dermatologists recommends annual skin checks by a physician in individuals who are at increased risk of skin cancer. [14] The College also recommended that all individuals perform SSE at least four times a year. Overall, females were more likely than their male counterparts to have their skin examined by a physician on an annual basis, however this difference was statistically insignificant (p=0.11). In addition, 28% of males reported to never having had their skin checked by a physician compared to only 8% of females. A similar trend was observed in the frequency of SSE. The reported frequency of SSE was significantly higher in females than males (p=0.040). Furthermore, the percentage of the male cohort that never (13%) or rarely (26%) performed SSE was much higher then the female cohort. The reasons behind this difference are not fully understood and are thought to be multifactorial, with some studies suggesting that men are less likely to get their skin examined by a doctor as they are less likely to identify themselves as at risk of skin cancer and are less likely to recognise suspicious lesions which require further investigation. [27] As nearly one third of men had never had their skin examined by a doctor or rarely perform SSE, they are at increased risk of premalignant or malignant lesions going unnoticed and progressing to aggressive cancer. It is therefore important that treating physicians recognise that males are less likely to get routine skin checks and that they need to be opportunistic during a consultation and educate the patient regarding skin cancer awareness and prevention.

Strengths and Limitations

A key strength of this qualitative study is that it addresses an important clinical area where the evidence base is weak. Although the study included 91 participants, we acknowledge the limitation of recruiting from only two medical practices in the Northern Rivers region. Furthermore, the difference in the age distribution between males and females may have influenced results. There is a high representation of the 55+ age group and males in the 18-20 ‘risk taking’ age group. This is representative of the patient population seen at the two practices but may not necessarily be a true representation of the patient population of the Northern Rivers Region. Future studies with a multivariate design to extract cofounding factors of sun protective behavior and interactions between attitudes and knowledge should extend these findings to larger, more diverse samples.

Clinical implications

This study has implications for both primary care physicians and public health campaigns such as the National Skin Cancer Awareness Campaign. Many of the male participants were unaware or had limited knowledge around types of skin cancers, adopting sun protective behaviours and secondary prevention strategies. Our data suggests several key areas of skin cancer awareness that can be targeted in future research and health promotion on both a local and national level.

Conclusion

Overall, our study demonstrates that females from the Northern Rivers, NSW are more knowledgeable about skin cancer than their male counterparts and are more likely to participate in sun protective behaviours and secondary prevention strategies, including skin self-examinations and clinical skin examinations by a medical practitioner. These findings of a gender divide are supported by several other international studies and can perhaps provide an explanation as to why a discrepancy exists in Australia with regard to the increased incidence of skin cancer observed within the male population. Increasing awareness of skin cancer within the male population, encouraging them to readily adopt sun protective behaviors and encouraging them to take notice of any changing or newly appearing skin lesions with regular review and follow up by a physician, has the potential to reduce skin cancer morbidity and mortality in Australia.

Acknowledgements

The author would like to thank Dr Naomi Piyaratna for her contribution to survey development and data collection and Dr Theresa Larkin from the Graduate School of Medicine, Wollongong University for her expertise and assistance in producing this research article.

Conflict of interest

The authors declare no conflicts of interest.

References

[1] Australian Institute of Health and Welfare 2008, Cancer in Australia an overview [Internet] 2008 [cited 2012 Aug 10]. Available from: http://www.aihw.gov.au/WorkArea/DownloadAsset.aspx?id=6442454588

[2] Bastuji-Garin S, Diepgan T. Cutaneous malignant melanoma, sun exposure, and sunscreen use: epidemiological evidence. British Journal of Dermatology. 2002; 146 (61):24-30.

[3] Wingo P, Ries L, Rosenberg H, Miller D, Edwards C. Cancer incidence and mortality, 1973-1995: a report card for the U.S. Cancer. 1998; 82:1197-1207.

[4] Chang A, Karnell L, Menck H. The National Cancer Data Base report on cutaneous and non-cutaneous melanoma: a summary of 84836 cases from the last decade. Cancer. 1988; 83:1664-1678.

[5] National Health and Medical Research Council (NHMRC). Primary prevention of skin cancer in Australia [Internet]. 1996 [cited 2012 Oct 09]. Avaliable from: http://www.nhmrc.gov.au/_files_nhmrc/publications/attachments/hp8.pdf

[6] Randle H. Basal cell carcinoma. Identification and treatment of the high risk patient. Dermatol Surg. 1996; 22:255-261.

[7] Demetrius R, Randle H. High risk nonmelanoma skin cancers. Dermatol Surg. 1998;24:1272-1292.

[8] Turner M. Sun safety: avoiding noonday sun, wearing protective clothing and the use of sunscreen. Journal of the National Cancer Institute. 1998;90: 1854–1855.

[9] Skin Cancer Foundation. New survey reveals gender divide surrounding skin cancer awareness and prevention. [Internet]. 2012 [cited 2012 September 09]. Avaliable from: http://www.skincancer.org/media-and-press/press-release-2012/survey

[10] Dummer R, Maier T. UV protection and skin cancer. Recent results cancer res. 2002;160:7-12.

[11] Naylor M, Farmer K. The case for sunscreens: A review of their use in preventing actinic damage and neoplasia. Arch Dematol. 1997;133:1146-1154.

[12] Oliveria S, Christos P, Marghoob A, Helpern A. Skin cancer screening and prevention in the primary care setting. 2001;16:297-301.

[13] Breitbart E, Waldman A, Nolte S. Systematic skin cancer screening in Northern Germany. J Am Acad Dermatol. 2012; 66:201-211.

[14] Australasian College of Dermatologists. How to check your skin moles. [Internet]. 2004 [cited 2012 Nov 23]. Avaliable from: http://www.dermcoll.asn.au/public/a-z_of_skin-how_to_check_your_skin_moles.asp
[15] Berwick M, Eredi F, Hay J. Melanoma epidemiology and public health. Dermatol Clin. 1999;27:205-214.

[16] Aitken J, Janda M, Lowe J, Elwood M, Ring I. Prevelence of whole-body skin self-examination in a population at high risk of skin cancer (Australia). Cancer causes and control. 2004;15:453-463.

[17] Balanda P, Lowe J, Stanton R, Gillepsie M. Enhancing the early detection of melanoma within current guidelines. Aust. J. Public Health. 1994;18:420-423.

[18] Sinclair C, Foley P. Skin cancer prevention in Australia. British Journal of Dermatology. 2009;109(3):116-123.

[19] Staples M, Elwood M, Burton R, Williams J. Non-melanoma skin cancer in Australia: the 2002 national survey and trends since 1985. Medical Journal Australia. 2006;184:6–10.

[20] Cancer Australia. Skin Cancer. [Internet]. 2010 [cited 2012 Oct 09]. Avaliable from: http://www.canceraustralia.gov.au/sites/default/files/images/Factsheets/Skin_Cancer_Factsheet.pdf

[21] Patel S, Nijhawan R, Stechschulte S, Parmet J. Skin cancer awareness, attitude, and sun protection behavior among medical students at the University of Miami Miller School of Medicine. Arch Dematol. 2010;146:797-800.

[22] Queensland Cancer Registry and Queensland Cancer Fund. Cancer in Queensland. Incidence and Mortality; 2005

[23] Department of Health and aging. Evaluation of the National skin cancer awareness campaign – Third phase (2009-2010). [Internet]. 2010 [cited 2012 Aug 10]. Avaliable from: http://www.skincancer.gov.au/internet/skincancer/publishing.nsf/Content/B31B922E2431D53FCA25782A00175847/$File/eval10.pdf

[24] Khan I. Evaluating public awareness about skin cancer [Internet]. 2010 [cited 2012 Oct 09]. Avaliable from:. https://vista.uow.edu.au/webct/urw/tp0.lc20663/cobaltMainFrame.dowebct

[25] Weinstock M, Rossi J, Redding C, Maddock J. Sun protection behaviors and stages of change for the primary prevention of skin cancer among beachgoers in southeastern New England. Annals of Behavioural Medicine. 2000;22:286-293.

[26] Stanton W, Janda M, Baade P, Anderson P. Primary prevention of skin cancer: a review of sun protection in Australia and internationally. Health Promot Int. 2004;19:369-378.

[27] Janda M, Baade P, Youl P, Aitken J, Whiteman K. The skin awareness study: Promoting thorough skin self-examination for skin cancer among men 50 years or older. Contemporay Clinical Trials. 2010;21:119-130.

Appendix

Appendix 1. Scoring for correctness of the modified Likert-type scale.
Categories
Original Research Articles

In vivo anatomical and functional identification of V5/MT using high-resolution MRI: a technique for relating structure and function in the human cerebral cortex

Previous in vivo neuroimaging studies have clearly demonstrated the functional specialisation of the human cerebral cortex. However, precise anatomical localisation of functionally defined cortical areas is an ongoing challenge due to the poor spatial resolution of functional imaging techniques and significant inter-individual differences in the complex morphological structure of the human cortex. The present study used high-resolution MRI to identify V5/MT in three subjects based on its distinctive MR-visible myeloarchitectonic structure. Consistent with previous studies, V5/MT was localised to the junction of the ascending limb of the inferior temporal sulcus and the lateral occipital sulcus. This anatomically defined location of V5/MT was shown to correspond with its functionally defined location, identified using fMR in one subject. Structural MR images with high spatial resolution were acquired in this study by combining increased MR field strength, a multi-channel phased-array head coil for image acquisition and signal averaging across a series of T1-weighted images. This study thus confirmed that MR contrast can be used to resolve intracortical lamination known to be present on a histological level, enabling cortical substructure to be visualised in vivo. It provided proof of concept in a single human subject; therefore, further validation of this novel technique for identification of V5/MT and other functionally defined cortical areas is required. Application of this methodology in its own right, or integrated with other MR-based neuroanatomical mapping techniques, will facilitate structure-function correlation throughout neocortex in living human subjects.

In vivo anatomical and functional identification of V5/MT using high-resolution MRI: A technique for relating structure and function in human cerebral cortexFunctional specialisation of human cerebral cortex has been demonstrated in vivo using positron emission tomography (PET) and functional magnetic resonance imaging (fMRI) [e.g. 1]. Current research is aimed at precise anatomical localisation of functionally defined areas. However, accurate localisation of active regions is an ongoing challenge given the poor spatial resolution of functional imaging and inter-individual variability in the complex morphological structure of cerebral cortex [2,3]. Consequently, location of cortical areas must be examined within an individual to obtain precise structure-function information.

Various techniques have been developed to indirectly correlate structure and function in cerebral cortex. Post-mortem human brain analysis following functional imaging would be ideal for precise anatomical localisation of functional regions within an individual; however, this is not readily available. Consequently, novel techniques were required to enable structure-function correlation in living humans.

Early research relied on presumed homology between human and non-human primate brains. Unfortunately, comparative variations in brain size, complexity, orientation and potential rearrangement of cortical areas between species makes comparison of functional anatomy difficult [4].

Brain atlases developed using traditional histological techniques to provide standardised coordinates for neuroanatomical landmarks have also been widely used. However, significant inter-individual variation in brain topography limits their usefulness in precisely identifying functional regions. For example, Talairach and Tournoux’s [5] atlas is based on one brain’s structure, over which Brodmann’s cytoarchitectonic map [6] was projected. Given that functionally defined areas can vary in location by centimetres, such an atlas can provide only gross localisation. Additionally, Brodmann’s two-dimensional map contained no data about the intrasulcal surface, two-thirds of cortical surface, so we can only estimate these borders [7,8].

Humans who have had a stroke, tumour, or traumatic brain injury also provide localisation information. Correlation of lesion location and subsequent neurological deficits provides information about the damaged region’s role. However, this technique’s usefulness is limited because (1) lesions are often extensive so accurately locating the area responsible for the missing function is difficult and (2) rarely is only a single function lost, because lesions tend to incorporate areas performing a range of roles [9].

Recent studies have revealed a successful new method of achieving precise anatomical localisation of functionally identified areas. Co-registration of structural MR with functional images from the same individual enables functionally defined regions to be mapped onto the specific morphological structure of each subject [10,11,12,13]. This approach to structure-function correlation relies on distinct anatomical features, in particular MR-visible cortical myeloarchitecture, e.g. the densely myelinated stria of Gennari, which demarcates primary visual cortex [14,15]. These techniques were used here to identify the visual motion area, V5/MT.

V5/MT is readily identifiable histologically because of its characteristic myelination. Clarke and Miklossy [16] first identified putative V5/MT in post-mortem brains at the occipito-temporal junction featuring distinctive myelination. These MR-visible myelin bands in layers I, IV and V (the latter two, the external and internal bands of Baillarger) and radial fibres crossing layers VI to IV help anatomically localise putative V5/MT at the junction of ascending limb of inferior temporal sulcus (ALITS) and lateral occipital sulcus (LOS) in parieto-temporo-occipital cortex [11,13]. This is largely consistent with functional results, showing that this functionally defined area also has anatomical identifiers.

V5/MT has been studied in non-human and human primates. Its location and role in non-human primates is similar, although not identical, to humans [17,18], as expected given the limitations of such studies, discussed above. Research in brain-damaged humans also supports V5/MT’s role in visual motion detection [19,20,21,22]; however, lack of imaging or post-mortem analysis has prevented accurate lesion localisation. Even using transcranial magnetic stimulation to mimic deficits experimentally [23,24] is limited by the extensive area such lesions encompass, likely responsible for a range of functions. Thus, structure-function correlation based on MR imaging in healthy humans represents significant progress in the field.

Recent studies have produced a robust non-invasive method of identifying functionally defined cortical areas in living humans [e.g. 11]. However, acquiring MR images with sufficient spatial resolution to precisely characterise underlying microarchitecture is an ongoing challenge. Our approach focused on improving resolution by applying advanced technology and analysis now available.

Precise anatomical localisation of functionally defined cortical areas relies on correlation of functional and structural images. Visualisation of cortical lamination requires a minimum MR resolution of 200-300m, since the thickest myelin band is 250m thick [9]. Standard T1-weighted images are generally acquired at 1-1.5mm3 resolution – it would take several hours to acquire a single T1-weighted image of 200-300m3 with equivalent signal intensity and signal-to-noise ratio (SNR). It is clearly unfeasible to expect subjects to remain stationary within the scanner for this time.

Several ways of increasing spatial resolution of T1-weighted images without relying on long scan times were used here. Firstly, the scanner’s magnetic field strength was increased from 1.5 to 3 Tesla (T), nearly doubling available signal, producing a corresponding SNR improvement [25], thus enhancing resolution. Secondly, a multi-channel phased-array head coil was used for image acquisition, increasing SNR using radiofrequency coils and combining multiple coils with individual receiver channels into an array covering the same volume as a larger coil with slight sensitive volume overlap, producing signal of equivalent amplitude but greatly reduced noise [26]. This improvement in SNR is particularly evident in surface regions [27], such as V5/MT. Thirdly, averaging signal across a series of T1-weighted images significantly reduced noise, improving SNR and enhancing visibility of fine architectonic detail [27], a technique validated by Walters et al. [11]. Additionally, voxel oversampling during averaging due to jitter from small inter-scan head movements increased signal and reduced partial volume error of single scans, improving neuroanatomical detail [28].

The current study thus applied a well-established methodology of non-invasive in vivo structural identification of functionally defined cortical areas developed by Walters et al. [11] to the precise anatomical localisation of V5/MT. We aimed to (1) validate this technique and (2) use technological advances to enhance MR images and improve microarchitecture detection. We hypothesised that this would produce improved spatial resolution of structural MR images, enhancing visualisation of cortical lamination within V5/MT.

Methods

Experiment 1: Identification of cortical microarchitecture using high-resolution MRI

Subject recruitment

Ethical approval was obtained. Three healthy male subjects (mean age 52) participated with informed consent.

Structural MRI
Twelve to sixteen high-resolution T1-weighted part brain images and three to four whole brain images were acquired over several sessions on a Siemens Trio 3T scanner using a 32-channel phased-array head coil (Siemens AG, Germany). Part brain parameters: three-dimensional magnetisation prepared rapid gradient echo (3D MP-RAGE) sequence: slices=144; thickness=0.75mm; field of view (FOV)=220mm; in-plane resolution=0.5×0.5mm2; echo time (TE)=3.41ms; repeat time (TR)=1800ms; inversion time (TI)=900ms; flip angle (FA)=9º; number of excitations (NEX)=1. Whole brain parameters: 3D MP-RAGE sequence: slices=256; thickness=0.60 mm; FOV=265 mm; in-plane resolution=0.6×0.6mm2; TE=2.81ms; TR=1900ms; TI=900ms; FA=9º; NEX=1. Raw images were transferred via a DICOM client program (Digital Jacket, Hewlett-Packard, CA), composed into contiguous volumes, and saved in Analyze (Radiological) format (Biomedical Imaging Resource, Mayo Foundation, MN).

Data analysis
Images were analysed using tools from Oxford Centre for fMRI of the Brain (FMRIB) Software library [29,30] and Mricro [31]. T1-weighted images were cropped at rostral spinal cord using Mricro [31] and automatically segmented to remove non-brain tissue using the FMRIB Brain Extraction Tool (BET) [32]. Each image was resampled at half the acquired voxel dimensions, producing volumes with voxel dimensions of 0.25×0.38×0.25mm3 for part and 0.30×0.30×0.30mm3 for whole brain images.

One part brain with minimal motion artefact was made the template for each scanning session. All images obtained in that session were registered to the template using a rigid body model with six degrees of freedom with the FMRIB Linear Image Registration Tool [33]. Template images for each session were then registered to the template for session one. Transformation matrices were concatenated and applied to each image. Transformed images were averaged using fslmaths [29], producing a mean high-resolution image.

A single whole brain T1-weighted image was acquired in each scanning session. Each of these images was registered to that acquired in session one. Transformation matrices were applied to each and transformed images averaged using fslmaths, producing a mean high-resolution image. SNR was calculated prior to and following image co-registration with regional intensity measured using ImageJ version 1.45 [34].

V5/MT’s site was estimated based on its postulated location at the ALITS and LOS intersection. Slices through this region were identified and two-dimensional cortical lamination analysis conducted. Intensity line profiles were manually generated using ImageJ version 1.45 [34]. The number, intensity and relative location of each stationary point or point of inflection between cortical surface and grey-white matter boundary were calculated. These measurements were used to generate a cortical lamination map and enabled comparison of lamination between subjects.

Experiment 2: In vivo structural identification of V5/MT using high-resolution MRI

Subject recruitment

Subject 2 was previously involved in Walters et al. [11].

fMRI
fMR data for subject 2 was obtained from Walters et al. [11]. Images were acquired on a 1.5T scanner (Signa Echospeed, General Electric). Subjects observed a moving checkerboard stimulus [13]. Further details available in Walters et al. [11].

Data analysis

Functional analysis was carried out by Walters et al. [11] using FLIRT [33] and SPM99 [35,36]. High-resolution T1-weighted anatomical image obtained for subject 2 was aligned with the average greyscale-normalised surface coil T1-weighted image acquired by Walters et al. [11]. The functional activation map was overlaid and used to identify functionally defined V5/MT for comparison with the location of anatomically defined putative V5/MT from Experiment 1.

Results
Experiment 1: Identification of cortical microarchitecture using high-resolution MRI
Figure 1 shows three T1-weighted MR slices for subject 2. Figure 1(i) shows the raw T1-weighted MR image, prior to de-skulling. The second panel (Fig 1(ii)) is from a single T1-weighted MR image; the third panel (Figure 1(iii)) shows the effect of co-registering multiple T1-weighted MR images within and across scanning sessions. The significant increase in spatial resolution produced by averaging is clearly evident. Quantitatively, this reflects a 34% improvement in SNR due to co-registration.

Figure 1: The effect of de-skulling then signal averaging across multiple T1-weighted MR images for subject 2. (i) A coronally-oriented slice from a single T1-weighted image prior to de-skulling. (ii) The same coronally-oriented slice from a single T1-weighted image after de-skulling using BET. (iii) An equivalent coronally-oriented slice from subject 2’s average T1-weighted part brain image, derived by co-registering multiple T1-weighted MR images using a linear algorithm using FLIRT.

Slices through putative anatomically defined V5/MT in the co-registered high-resolution structural T1-weighted MR images for all subjects are shown in Figure 2 (left). Visual examination of the areas of interest (Figure 2, middle) showed two horizontally oriented bands within the cortical ribbon. Intensity line profile analysis through putative V5/MT at this point (AB) is also shown in Figure 2 (right). This enabled quantification of the location of these bands. The first was close to the cortical surface, at 30% grey matter depth while the second was at 65% cortical thickness. The intensity line profile for subject 2 (Figure 2 (vi)) also suggested a third band near the grey-white matter junction (90% depth), consistently identified as either a local maximum or point of inflection.

Figure 2: In vivo structural MR results from subjects 1 (left hemisphere), 2 (left hemisphere) and 3 (left hemisphere). The left column shows coronally-oriented slices through putative anatomically defined V5/MT in subjects 1 (i), 2 (iv) and 3 (vii). The region of interest has been highlighted (white boxes). The middle column shows an enlarged view of the highlighted area in (i), (iv) and (vii) for subjects 1 (ii), 2 (v) and 3 (viii) with a red line (AB) through the one of the banks of the sulcus indicating the site of cortical lamination analysis. The right column shows intensity line profiles along the red line AB of (ii), (v) and (viii) showing two intensity maxima for subjects 1 (iii), 2 (vi) and 3 (ix), with an additional point of inflection at 90% cortical depth for subject 2. Cortical depth is normalised to 0-100% from the outer cortical boundary to the grey/white matter junction.

Intensity line profiles of putative V5/MT are clearly different to surrounding cortex. The opposite sulcal bank is characterised by a single, wide peak at 45% cortical thickness (Figure 3).

Figure 3: In vivo structural MR results from subject 2 (left hemisphere). (i) Coronally oriented slice through putative anatomically defined V5/MT. The region of interest has been highlighted (white box). (ii) Enlarged view of the highlighted area in (i) with a red line (AB) through the upper bank of the sulcus indicating the site of cortical lamination analysis, as in Figure 2 (v). (iii) Intensity line profile along the red line AB of (ii), showing two intensity maxima, as in Figure 2 (vi).  Cortical depth is normalised as described in Figure 2. (iv) The same coronally oriented slice as in (ii) with a yellow line (CD) through the lower bank of the sulcus indicating the site of cortical lamination analysis. (v) Intensity line profile along the yellow line CD of (iv), showing a single intensity maximum.
Figure 3: In vivo structural MR results from subject 2 (left hemisphere). (i) Coronally oriented slice through putative anatomically defined V5/MT. The region of interest has been highlighted (white box). (ii) Enlarged view of the highlighted area in (i) with a red line (AB) through the upper bank of the sulcus indicating the site of cortical lamination analysis, as in Figure 2 (v). (iii) Intensity line profile along the red line AB of (ii), showing two intensity maxima, as in Figure 2 (vi). Cortical depth is normalised as described in Figure 2. (iv) The same coronally oriented slice as in (ii) with a yellow line (CD) through the lower bank of the sulcus indicating the site of cortical lamination analysis. (v) Intensity line profile along the yellow line CD of (iv), showing a single intensity maximum.

Experiment 2: In vivo structural identification of V5/MT using high-resolution MRI

Functionally-defined V5/MT for subject 2 was identified on the high-resolution structural T1-weighted MR image acquired in this study using functional data from Walters et al. [11]. This region sits at the junction of ALITS and LOS. Other areas of activation correspond largely with lower order visual areas; there are also areas of parietal activation. Figure 4(i) shows a high-resolution slice through subject 2’s brain with overlaid foci of functional activation. Figure 4(ii) is an enlarged view of the region, with functional activation overlying the location of putative V5/MT identified in Experiment 1. These functional results correlate strongly with the spatial location of putative V5/MT. Characteristic intensity line profiles are thus effective anatomical identifiers for V5/MT.

Figure 4: In vivo structural MR and fMR results from subject 2 (left hemisphere). (i) Coronally oriented slice through high-resolution MR image with overlaid functional activation map. The region of interest has been highlighted (white box). (ii) Enlarged view of the highlighted area in (i) showing co-localisation of functional activation and putative anatomically defined V5/MT identified in Experiment 1 (white arrow).

Discussion

This study employed a well-established methodology of non-invasive in vivo identification of functionally defined cortical areas to determine V5/MT’s precise location. Efficacy of the technique pioneered by Watson et al. [13] and extended to fMRI by Walters et al. [11] was confirmed. High-resolution structural MR images were successfully acquired and intensity line profiles drawn through putative V5/MT. Co-registration of functional data from Walters et al. [11] with new high-resolution structural data confirmed the putative anatomical location of V5/MT at the junction of ALITS and LOS in subject 2, consistent with previous studies [10,11,13].

Intensity line profile analysis has been used previously [37,11] to quantify cortical lamination. Current results are consistent with previous findings, demonstrating light-coloured bands at 30% and 65% cortical depth. Subject 2’s data suggest a third band near the grey-white matter junction. The first two likely correspond to the heavily myelinated internal and external bands of Baillarger identified in putative V5/MT in post-mortem brains [11]. The origin of the third band may correspond with radial fibres traversing lower cortical layers, also described in post-mortem specimens. These results thus confirm V5/MT’s characteristic T1-weighted MR appearance. Intensity line profiles distinguish putative V5/MT from surrounding cortex. Profiles of the opposite sulcal bank are characterised by a single, wide peak at 45% depth (Figure 3), consistent with lamination described by Walters et al. [11].

There is a strong correlation between putative V5/MT’s spatial location and functional results for subject 2. This confirms that the characteristic intensity line profiles from this region are distinctive anatomical identifiers for human V5/MT, verifying Walters et al. [11]. Quantitative comparison of the intensity of line profile maxima through V5/MT here and in Walters et al. was not possible due to different techniques used to derive cortical lamination maps. Qualitatively, however, the peaks of local maxima (Figure 2) are less well defined than those previously obtained. This reflects reduced SNR with the present paradigm.

On a whole brain level, high-resolution T1-weighted MR images acquired in this study clearly have superior spatial resolution compared to those in Walters et al. [11] However, this overall improvement in resolution is at the expense of reduced SNR at the site of interest i.e. putative V5/MT. This is reflected qualitatively as less well-defined maxima on intensity line profiles. In comparison, images obtained previously have high resolution at V5/MT, but lower resolution across remaining cortex. This represents a significant benefit of using surface coils placed directly over the cortex compared to the current paradigm. The potential for concurrent use of these techniques warrants exploration.

This novel approach to improving MR spatial resolution combined technological advances with innovative image analysis. MR scanning hardware is improving rapidly with improved access to high magnetic field strength scanners and multi-channel phased-array head coils. The technique of signal averaging across images from successive sessions is also relatively recent. We demonstrated that these new tools can be successfully applied to produce T1-weighted MR images with high SNR, enabling detection of cortical lamination.

The application of this new approach to in vivo structure-function correlation in the human cortex requires further validation. This study provides proof of concept in a single subject. High-resolution structural MR images obtained for two others clearly demonstrate the efficacy of this approach in enabling visualisation of cortical microarchitecture; unfortunately, functional identification of V5/MT in these subjects was not possible. Future extension of this study will help resolve this issue.

Imaging techniques used here significantly reduced analysis complexity. Twin surface coil arrangements used by Walters et al. [11] with narrow fields of view resulted in complicated signal attenuation requiring correction prior to registration. This processing step was not required here. Further, use of a multi-channel phased-array head coil also enabled examination of subcortical microarchitecture since high SNR is not restricted to cortical surface. Acquisition of images with high SNR over a larger field of view represents significant progress.

As suggested by Walters et al. [11], this technique can be broadly applied to identification of cortical architecture in living humans. Its usefulness has not yet been fully explored with studies restricted to V1 and V5/MT [14,11,12]. Given the strong contribution of myeloarchitecture to MR signal, further studies investigating non-visual cortex should focus on Flechsig’s37 fields of increased myelination to maximise initial success.

Development of imaging and analysis techniques enabling visualisation of cortical lamination opens up new research areas. For example, if functionally active areas are well-characterised microanatomically in vivo using high-resolution MR, major input and output cortical layers can be identified. This would require new task paradigms with multiple conditions activating a functional area in different ways, thus involving distinct pathways [39]. Additionally, anatomical localisation of functionally defined areas could guide medical therapy, like that achieved with deep brain stimulation in Parkinson’s disease [40]. Further research in these areas is required.

Conclusions

This study confirmed that MR contrast can resolve intracortical lamination present histologically, enabling visualisation of cortical substructure in vivo. It employed improved MR hardware and analysis to validate Walters et al. [11], including V5/MT’s characteristic MR profile, and identified further microarchitectonic detail. Further optimisation of techniques to improve lamination detection is required to maximise results. Application of this methodology alone, or integrated with other MR-based mapping, will facilitate structure-function correlation throughout the neocortex in living humans.

Acknowledgements

I am very grateful for the training in MR analysis provided by Jennifer Leech, Ayaka Ando, Alicia Dymowski and Dr Marcus Gray, technical support from Sina Sadeghi and Dr Neil Killeen, and assistance with MR imaging from Michael Kean. This research was supported by funds from the Florey Neuroscience Institutes, Melbourne. I was also grateful to receive the Dr Charlotte Last Memorial Scholarship for Honours in Medicine from the Sydney Medical School.

Conflict of Interest

None declared.

Correspondence

S Barnes: stephaniebarnes01@gmail.com

References

[1] Zeki, S., Watson, J.D., Lueck, C.J., Friston, K.J., Kennard, C., & Frackowiak, R.S. (1991). A direct demonstration of functional specialization in human visual cortex. The Journal of Neuroscience, 11(3), 641-649.

[2] Iaria, G., & Petrides, M. (2007). Occipital sulci of the human brain: variability and probability maps. The Journal of Comparative Neurology, 501, 243-259.

[3] White, L. E., Andrews, T. J., Hulette, C., Richards, A., Groelle, M., Paydarfar, J., & Purves, D. (1997). Structure of the human sensorimotor system. I: Morphology and cytoarchitecture of the central sulcus. Cerebral cortex, 7, 18-30.

[4] Sereno, M. I., & Tootell, R. B. H. (2005). From monkeys to humans: what do we now know about brain homologies? Current Opinion in Neurobiology, 15, 135-144.

[5] Talairach, J., & Tournoux, P. (1988). Co-planar stereotaxic atlas of the human brain: 3-dimensional proportional system: an approach to cerebral imaging. New York: Thieme Medical Publishers.

[6] Brodmann, K. (1909). Vergleichende Lokalisationslehre der GroBhirnrinde in ihren Prinzipien dargestellt auf Grund des Zellenbaues. Leipzig: Barth.

[7] Zilles, K., & Amunts, K. (2010). Centenary of Brodmann’s map – conception and fate. Nature Reviews Neuroscience, 11.

[8] Zilles, K., Armstrong, E., Schleicher, A., & Kretschmann, H.-J. (1988). The human pattern of gyrification in the cerebral cortex. Anatomy and Embryology, 179, 173-179.

[9] Bridge, H., & Clare, S. (2006). High-resolution MRI: in vivo histology? Philosophical Transactions of the Royal Society B: Biological Sciences, 361, 137-146.

[10] Dumoulin, S., Bittar, R., Kabani, N., Baker, C., Le Goualher, G., Pike, G., & Evans, A. (2000). A New Anatomical Landmark for Reliable Identification of Human Area V5/MT: a Quantitative Analysis of Sulcal Patterning. Cerebral Cortex, 10, 454-463.

[11] Walters, N., Egan, G., Kril, J., Kean, M., Waley, P., Jenkinson, M., & Watson, J. (2003). In vivo identification of human cortical areas using high-resolution MRI: An approach to cerebral structure-function correlation. Proceedings of the National Academy of Sciences, 100, 2981-2986.

[12] Walters, N., Eickhoff, S., Schleicher, A., Zilles, K., Amunts, K., Egan, G., & Watson, J. (2007). Observer-Independent Analysis of High-Resolution MR Images of the Human Cerebral Cortex: In Vivo Delineation of Cortical Areas. Human Brain Mapping, 28, 1-8.

[13] Watson, J., Myers, R., Frackowiak, R., Hajnal, J., Woods, R., Mazziotta, J., Shipp, S., & Zeki, S. (1993). Area V5 of the Human Brain: Evidence from a Combined Study Using Positron Emission Tomography and Magnetic Resonance Imaging Cerebral Cortex, 3, 79-94.

[14] Clark, V., Courchesne, E., & Grafe, M. (1992). In vivo Myeloarchitectonic Analysis of Human Striate and Extrastriate Cortex Using Magnetic Resonance Imaging. Cerebral Cortex, 2, 417-424.

[15] Barbier, E., Marrett, S., Danek, A., Vortmeyer, A., van Gelderen, P., Duyn, J., Bandettini, P., Grafman, J., & Koretsky, A. (2002). Imaging Cortical Anatomy by High-Resolution MR at 3.0T: Detection of the Stripe of Gennari in Visual Area 17. Magnetic Resonance in Medicine, 48, 735-738.

[16] Clarke, S., & Miklossy, J. (1990). Occipital cortex in man: Organization of callosal connections, related myelo- and cytoarchitecture, and putative boundaries of functional visual areas. The Journal of Comparative Neurology, 298, 188-214.

[17] Zeki, S. M. (1969). Representation of central visual fields in prestriate cortex of monkey. Brain Research, 14, 271-291.

[18] Cragg, B. G., & Ainsworth, A. (1969). The topography of the afferent projections in the circumstriate visual cortex of the monkey studied by the Nauta method. VIsion Research, 9, 733-747.

[19] Goldstein, K., & Gelb, A. (1918). Psychologische Analysen hirnpathologischer Falle auf Grund von Untersuchungen Hirnverletzter. I. Abhandlung. Zur Psychologie des optischen Wahrnehmungs-und Erkennungsvorganges. Zeitschrift fur die gesamte Neurologie und Psychiatrie, 41, 1-
142.

[20] Potzl, O., & Redlich, E. (1911). Demonstration eines Falles von bilateraler Affektion beider Occipitallappen. Wiener Klinische Wochenschrift, 24, 517-518.

[21] Zihl, J., Von Cramon, D., & Mai, N. (1983). Selective disturbance of movement vision after bilateral brain damage. Brain, 106, 313-340.

[22] Riddoch, G. (1917). Dissociation of visual perceptions due to occipital injuries, with especial reference to appreciation of movement. Brain, 40, 15-57.

[23] Beckers, G., & Homberg, V. (1992). Cerebral visual motion blindness: transitory akinetopsia induced by transcranial magnetic stimulation of human area V5. Proceedings of the Royal Society of London B: Biological Sciences, 249, 173-178.

[24] Beckers, G., & Zeki, S. (1995). The consequences of inactivating areas V1 and V5 on visual motion perception. Brain, 118, 49-60.

[25] Schmitt, F., Grosu, D., Mohr, C., Purdy, D., Salem, K., Scott, K. T., & Stoeckel, B. (2004). 3 Tesla-MRT: Der Erfolg hoherer Feldstarken. Radiologe, 44, 31-48.

[26] Bernstein, M. A., King, K. F., & Zhou, Z. J. (2004). Handbook of MRI pulse sequences. Amsterdam: Elsevier: Academic Press.

[27] de Zwart, J. A., Ledden, P. J., van Gelderen, P., Bodurka, J., Chu, R., & Duyn, J. H. (2004). Signal-to-noise ratio and parallel imaging performance of a 16-channel receive-only brain coil array at 3.0 Tesla. Magnetic Resonance in Medicine, 51, 22-26.

[28] Holmes, C. J., Hoge, R., Collins, L., Woods, R., Toga, A. W., & Evans, A. C. (1998). Enhancement of MR images using registration for signal averaging. Journal of Computer Assisted Tomography, 22, 324-333.

[29] Smith, S. M., Jenkinson, M., Woolrich, M. W., Beckmann, C. F., Behrens, T. E. J., Johansen-Berg, H., Bannister, P. R., De Luca, M., Drobnjak, I., Flitney, D. E., Niazy, R., Saunders, J., Vickers, J., Zhang, Y., De Stefano, N., Brady, J. M., & Matthews, P. M. (2004). Advances in functional and structural MR image analysis and implementation as FSL. Neuroimage, 23, 208-219.

[30] Woolrich, M. W., Jbabdi, S., Patenaude, B., Chappell, M., Makni, S., Behrens, T., Beckmann, C., Jenkinson, M., & Smith, S. M. (2009). Bayesian analysis of neuroimaging data in FSL. Neuroimage, 45, S173-186.

[31] Rorden, C., & Brett, M. (2000). Stereotaxic display of brain lesions. Behavioural Neurology, 12, 191-200.

[32] Smith, S. M. (2002). Fast robust automated brain extraction. Human Brain Mapping, 17, 143-155.

[33] Jenkinson, M., & Smith, S. M. (2001). A global optimisation method for robust affine registration of brain images. Medical Image Analysis, 5, 143-156.

[34] Abramoff, M. D., Magalhaes, P. J., & Ram, S. J. (2004). Image processing with ImageJ. Biophotonics International, 11, 36-42.

[35] Friston, K. J., Holmes, A. P., & Worsley, K. J. (1999). How many subjects constitute a study? Neuroimage, 10, 1-5.

[36] Friston, K. J., Holmes, A. P., Worsley, K. J., Poline, J.-P., Frith, C. D., & Frackowiak, R. S. J. (1995). Statistical parametric maps in functional imaging: a general linear approach. Human Brain Mapping, 2, 189-210.

[37] Fatterpekar, G. M., Naidich, T. P., Delman, B. N., Aguinaldo, J. G., Gultekin, S. H., Sherwood, C. C., Hof, P. R., Drayer, B. P., & Fayad, Z. A. (2002). Cytoarchitecture of the human cerebral cortex: MR microscopy of excised specimens at 9.4 Tesla. American Journal of
Neuroradiology, 23, 1313-1321.

[38] Flechsig, P. (1920). Anatomie des menschlichen Gehirns und Ruckenmarks auf myelogenetischer Grundlage. Leipzig: Thieme.

[39] Turner, R. (2012). Myeloarchitecture – a window for MRI. In Organization for Human Brain Mapping. Beijing, China.

[40] Benabid, A.L., Chabardes, S., Mitrofanis, J. & Pollak, P. (2009). Deep brain stimulation of the subthalamic nucleus for the treatment of Parkinson’s disease. Lancet Neurology, 8(1): 67-81.

Categories
Original Research Articles

Test-retest reliability of isometric hip muscle strength measured using handheld dynamometry: a pilot study

Introduction: Hip muscle weakness has been shown to be associated with lower limb pain and (re)injury. A reliable means of assessing hip muscle strength is required to assist sports physicians, orthopaedic surgeons, and physiotherapists in assessing injury risk and applying preventative measures such as appropriately prescribed and monitored exercise intervention. This study aimed to determine the relative and absolute test-retest reliability of a testing procedure assessing the isometric strength of hip flexors, extensors, abductors, adductors, internal rotators, and external rotators using handheld dynamometry.
Methods: 10 healthy subjects with an average age of 25.5 years (± SD 6.0 years) had the isometric strength of their six hip muscle groups measured by one tester using a handheld dynamometer. Subjects were tested on two separate occasions with an average interval of 5.7 days. Intra-class correlation coefficients (ICC) and the standard error of measurement (SEM) were used as measures of relative and absolute reliability respectively.
Results: All six hip muscle groups demonstrated ‘excellent’ test-retest relative reliability (ICC 0.86–0.97). Absolute reliability ranged from 3.3–7% and 0.03–0.13 Nm/kg as a measure of unit strength.
Discussion: This protocol demonstrates excellent test-retest reliability for analysis of the isometric strength of all six hip muscle groups using a handheld dynamometer. This protocol serves as an important reference for clinical assessment of hip muscle function.

Introduction
Test-retest reliability of isometric hip muscle strength measured using handheld dynamometry: a pilot studyAdequate hip muscle strength is required to control the alignment of the lower limb and therefore limit exposure of distal structures to potentially damaging forces. [1] Deficits in hip muscle strength have demonstrated an association with pain and (re)injury in the hip, [2,3] knee, [4,5] and ankle. [6] Consistent with these observations, strengthening of hip muscles through exercise interventions has been shown to reduce lower limb pain and injury, [7,8] improve lower limb landing alignment, and minimise potentially injurious positions. [9] Given this well established link between hip muscle strength impairment, pain, and (re)injury; a reliable, clinically applicable means of measuring hip muscle function is necessary to assist clinicians in the development and monitoring of interventions aimed at minimising pain and (re)injury, and improving patient function.

In the clinical setting, strength is conventionally assessed using manual muscle testing (MMT). MMT provides only a rated score (ranging from zero to five) of strength [10] and relies on clinical judgement of strength relative to the contralateral limb and/or previous strength testing experiences. A more quantitatively accurate measure of muscle strength can be obtained using dynamometry. Dynamometry measures the force produced on a maximum voluntary contraction and in contrast to MMT it provides an objective unit measure of strength. Many laboratory dynamometry stations used previously [11,12] have poor clinical utility as they are expensive and lack easy portability. In contrast, handheld dynamometry is an inexpensive and portable means of measuring strength amenable to clinical use.
Reliability is also an important component of clinical utility. Relative and absolute reliability have been identified as two distinct measures. [13] Relative reliability assesses the level of agreement between values. [14] It provides information about the association between test-retest data but not the proximity of the values. [13] Absolute reliability measures the variability between test-retest data, with less variability representing greater reliability. [13] A number of studies have assessed the reliability of handheld dynamometry on hip muscle strength testing. [7,15-20] A small number have established reliability using a handheld device for all six hip muscle groups. [2,21,22] These studies have included strength testing positions where the tester is required to stabilise the subject or hold the non-test limb during testing, leaving only one arm available to counteract the force produced by the hip muscles. Given the magnitude of force produced by the hip muscles [18] and that reliability is affected by the tester’s ability to apply sufficient counteracting force, [23] it is important that for a reliable strength testing procedure, positions are chosen to facilitate stability for not only the subject but also the tester.

There is no single, universally accepted testing protocol for all six hip muscle groups. Previous investigations have included testing positions that have required the tester to stabilise the subject. More stable testing positions are required to account for the magnitude of force produced by the hip musculature. The purpose of this pilot study was to therefore assist in establishing the test-retest relative and absolute reliability of a strength testing protocol for hip flexion, extension, abduction, adduction, internal rotation, and external rotation using handheld dynamometry.

Methods

Subjects

Approval for this study was obtained through the University of South Australia Human Research Ethics Committee. Five healthy male and five healthy female subjects were recruited via a convenience sample through an Adelaide Physiotherapy and Sports Medicine clinic. The means and standard deviations of height (1.72m ± 0.09m), mass (71.7 ± 9.9kg), and age (25.5 ± 6.0 years) were established. Subjects were included if they had no history of pain or clicking/clunking sensations from either hip joint. Subjects were excluded if they reported pain during the strength assessment period that would limit the production of a maximum voluntary contraction. Furthermore, to limit error in the measures that may be due to strength gains from exercise training, subjects were excluded if they were participating in regular lower limb strengthening exercises. Strength was assessed by the same tester on two separate occasions with an average test-retest interval of 5.7 days (range 5–7 days). All subjects were graded as performing at a ‘sufficient’ level of physical activity measured using the Active Australia Survey. [24]

Strength Assessment

Strength of the six hip muscle groups was measured using a Nicholas handheld dynamometer (HHD) (Lafayette Instruments, Lafayette, IN, USA). Strength data was recorded in kilograms (kg) and then converted to torque values with the force in Newtons (N) (where 1kg = 9.81N) multiplied by the action length in metres (m), giving a unit of Newton-metres (Nm). The action length is the perpendicular distance from the axis of rotation to the line of force (i.e. the placement point of the dynamometer). The action length for flexion, extension, abduction, and adduction was measured as the distance from the greater trochanter of the femur to the lateral femoral epicondyle, and for rotation from the lateral femoral condyle to the base of the lateral malleolus. Each action length was recorded as the average of two measures for each measured action length based on the protocol for measuring limb length validated by Beattie and colleagues. [25] To account for the confounding effect of body size on strength, [26] data was normalised to body mass, which was measured in kilograms (kg) using the same scales (Hanson, Croissy-sur-Seine, France) for each subject.

Subjects were tested on the same height adjustable plinth. Strength was assessed using the ‘make’ test where the subject’s isometric muscle action is matched by the tester. [17] To ensure the dynamometer force plate was maintained in a perpendicular position relative to the test limb, the tester’s arm was positioned with elbows locked in extension. Pillows were used as required to achieve and maintain subject positions with the hip joint in a neutral orientation in reference to adduction, abduction, internal rotation, and external rotation for all positions (Figure 1). Participants were given instructions including a description and passive demonstration of the action required, the movements to avoid, and the instruction to “push as hard as you can”. They were asked to give one sub-maximal contraction of 50 percent effort, followed by three tests of maximal effort (consistent with previous methodologies used [15]) separated by a 5 second rest. Tests were initiated and ceased with a single beep and not the tester’s verbal commands. Given that isometric muscle strength has been shown to be influenced by motivational states, [27] this method was employed to limit the tester’s influence over the subject’s performance through varying volume or verbal inflections that can differentially affect subject effort. Therefore no encouragement was offered during tests. The strongest of the tests was recorded. If the last test produced the strongest result the subject was retested to ensure improvements in strength were not a result of habituation and the subject’s best effort or maximum had been achieved. Subjects were retested if they reported failure to achieve maximum effort, or if stabilisation of the device and/or subject during testing was inadequate. The dynamometer limited tests to five seconds, to allow enough time for the generation of maximum tension. [17] The maximum force produced within the five second test period was recorded by the dynamometer. Because several muscles within the hip contribute to more than one hip joint movement, the order of strength assessment was randomised between participants. The tester was blind to strength data from the first test session until retest data was gathered.

Subject Positioning

Hip flexion was measured in sitting, with the hip and knee flexed to 90o (Figure 1a). The plinth height was standardised for each subject as the height of two fingers between the plantar-flexed foot and the floor, hence feet were not in contact with the ground, eliminating compensation by calf muscles. For the remaining muscle groups the plinth was adjusted to be as low as possible. The HHD was positioned on the surface of the skin immediately proximal to the superior pole of the patella (as shown previously [15]). Hip extension was measured in prone with the hips in neutral (Figure 1b) and legs supported by a foam wedge. The dynamometer was placed on the surface of the skin of the posterior thigh two centimetres proximal to the femoral epicondyles. [21,28] Participants were instructed to lift their thigh from the table without bending or straightening their knees, or pushing their shin into the foam wedge. Hip abduction and adduction were measured in side lying (Figure 1c, d). The subject was instructed to lift their test limb into the air while keeping their pelvis and knees straight and not to rotate their thigh in or out. The dynamometer was placed immediately superior to the lateral (abduction) and medial (adduction) femoral epicondyles. [21] Internal rotation and external rotation were assessed in side lying with the subject instructed to rotate their thigh by lifting the ankle of their test limb into the air (Figure 1e, f). The dynamometer was placed two centimetres proximal to the lateral (internal rotation) and medial (external rotation) malleoli. [21]

Data Analysis

Histograms and values of skewness demonstrated all data to be distributed normally. Bland-Altman plots were used to determine if there was a relationship between magnitude and measurement error (heteroscedasticity) present within the data. [29] Paired t-tests were used to determine the presence of systematic bias. [29] A probability level of 5% (p < 0.05) was assumed to be significant. Relative reliability was established via intra-class correlation coefficients (model 2,1) (ICC) and were interpreted as excellent (> 0.75), fair to good (0.40 to 0.75), or poor (< 0.40) according to classifications by Shrout and Fleiss. [30] Absolute reliability was assessed using the standard error of measurement (SEM) and was calculated by the equation: [SEM = SD x √(1 – ICC)], where SD is the standard deviation of the strength data from all subjects for each muscle group. [14] The SEM was presented as a unit of strength (Nm/kg) and as a percentage of the average of test and retest means of each muscle group as per previous methods. [22] A threshold beyond which a true change in strength is said to have occurred was determined for each muscle group. This is termed the minimum detectable change (MDC) and was calculated by multiplying the SEM by the square root of 2 (to account for error associated with repeated measures) and the z-score of 1.64 to establish a 90% confidence interval. [16] This confidence interval was dictated by the sample size. All data was analysed using SPSS for Windows 17.0 (SPSS, SPSS Inc., Chicago, IL, USA).

Figure 1. Subject positioning for strength testing of (a) flexion, (b) extension, (c) abduction, (d) adduction, (e) internal rotation, (f) external rotation.

Results

Paired t-tests showed no differences (p > 0.05) between repeated measures for all muscle groups. Bland-Altman plots showed no heteroscedasticity present within the data. ICC values, as a measure of relative reliability, ranged from 0.86 – 0.97 (Table 1), which is classified as ‘excellent’ reliability by Shrout and Fleiss. [30] The lower boundary of the 95% confidence interval fell below this classification for hip flexion only (Table 1). As a measure of absolute reliability, the SEM represented as a unit of strength ranged from 0.03 Nm/kg to 0.13 Nm/kg and as a percentage from 3.3% to 7% (Table 1). MDC data ranged from 0.070 Nm/kg to 0.302 Nm/kg (Table 1) and represented the minimum change required in subsequent testing to reason with 90% confidence that a true change in strength has occurred and that differences are not a result of measurement error.

Table 1. The test and retest strength (Nm/kg) means and their standard deviations. Paired t-tests showed no difference between these means (p > 0.05). Also shown are the intra-class correlation coefficients (model 2,1) (ICC) and their 95% confidence intervals, the standard error of measurements (SEM) as units of strength (Nm/kg) and as a percentage of the average of test and retest means, and the minimum detectable change (MDC) (Nm/kg).

Discussion

This study contributes to the establishment of a reliable isometric strength testing protocol for hip flexion, extension, abduction, adduction, internal rotation, and external rotation using handheld dynamometry. This protocol serves as an important reference for clinical assessment of hip muscle function. Both relative and absolute test-retest reliability were assessed, giving insight into both the level of agreement and variability between repeated measures. Overall, findings were consistent with analysis of the present study’s raw force data, indicating that the measurement of action length and body mass did not affect reliability. Relative reliability was examined using intra-class correlation coefficients. This method differs from previous studies, which calculated the level of agreement via Pearson’s correlation coefficient, [2,21] a measure designed to assess the relationship between two variables rather than the same variable tested twice. [31]‘Excellent’ relative reliability [30] was demonstrated for the strength testing procedure for all six hip muscle groups (Table 1). This classification is comparable with analyses of the less clinically applicable ‘gold standard’ [32] laboratory dynamometry stations [11,28] and hand-held dynamometry investigations that assessed reliability from data gathered in the same test session, [21] where reliability may be overstated because the variable of subject setup is not tested twice. The use of two test occasions may leave the present study more exposed to systematic error. However, the absence of such error is supported by paired t-tests (p > 0.05) and normally distributed data. Absolute reliability was examined using the SEM. During repeated measures, some variability will be observed even if there is no reason to suspect a change in strength parameters. Given the SEM assumes an absence of heteroscedasticity, Bland-Altman plots were necessary as ratio data, such as that of the present study, is susceptible to an increase in measurement error as the measured value increases. [29]

The adductors had the largest SEM (7%); however, their ICC value indicated good agreement (0.94). The standard deviation observed in test and retest adduction means is consistent with heterogeneity that, where present, will inflate the ICC value. [13] The level of error demonstrated here by the SEM may be explained by the sensitivity of the area of the thigh where the HHD was placed. For subjects who consequently reported discomfort a hand towel was placed under the HHD to allow a maximum voluntary contraction. Nonetheless, this level of error is still comparable with previous investigations (7.8%) assessing hip adduction in this position, but with the HHD placed at the ankle. [22]

The hip flexors demonstrated the lowest ICC (0.86). Although these findings are in contrast to previous analyses of laboratory dynamometry (0.70–0.71), [11] the lower boundary of the ICC confidence interval (0.53) in the present study must be considered in the interpretation of this value. Given that the ability to counteract the force produced by the subject affects reliability, [18] it follows that the hip flexors, which generated the greatest torque, also demonstrated the lowest ICC. Furthermore, to prevent the subject from ‘cheating’ by the use of their calf muscles (see Methods), the plinth height was raised. As a result, the tester’s ability to position their upper body to provide sufficient counteracting force may have been compromised. As abduction and extension were tested with the plinth set as low as possible, this rationale is consistent with these muscle groups producing the next highest mean torque values, but also demonstrating the highest ICC (0.97). This ICC value is inconsistent with that demonstrated for abduction previously, [22] where the side-lying position was also adopted (ICC 0.74). Here the authors used one hand to hold the dynamometer and the other to stabilise the pelvis. While this aims to maximise subject stability, it may compromise the tester’s ability to counteract the force produced. Force being a vector, it has components of magnitude and direction. Changes in orientation of the HHD relative to the line of force of the hip motion may influence force transmission to the HHD (Figure 2). Using only one arm to hold the dynamometer may be insufficient to properly counteract both the magnitude and the direction of the force produced. Given that controlling for both these components of force is influenced by the tester, the present study chose positions that maximise not only the stability of the subject, but also that of the tester. These positions sought to permit the tester to position themselves and the HHD above and in line with the line of action of the test limb and were not dependent on the tester to stabilise the subject. Internal rotation and external rotation positions were hence also dictated by this notion with both demonstrating relative and absolute reliability comparable with previous findings supporting their use as a potential alternative to the more commonly utilised sitting position. [5,15,16,21,22]

Figure 2. The effects of changes in the angle of the dynamometer force plate relative to the line of motion of the test limb on force recorded during strength testing. Here the dynamometer is no longer in line with the line of force of the hip motion, (i.e. the angle has increased from 0o). If Ѳ is equal to 30o, and a subject produces 100 Newtons (N), then 116.3 Newtons will be transmitted to the dynamometer (C = 100 Newtons/cosine 30o).

Although this study demonstrates excellent test-retest reliability, the limitations must be acknowledged. The nature of this investigation as a pilot study dictated the sample size and while the reliability established is comparable with previous studies of larger samples (e.g. Pua et al. [16]), further analysis may be needed to investigate the lower boundary of the confidence interval of the flexion ICC. Secondly, the MDC data offer clinicians guidelines as to when ‘real’ changes in strength have occurred which will assist in interpreting and monitoring data before and after intervention. However, given this study did not assess reliability between multiple testers, MDC data is based on the assumption that the clinician uses the dynamometer reliably and they therefore have sufficient strength to match those being tested, as is assumed to be the case in the present study given the findings. Finally, the action length will not have fully represented the length from the centre of the axis of rotation. However because of the deep location of the hip joint, the greater trochanter was reasoned to be a more reliable landmark to measure from.

Conclusion

The present study’s protocol demonstrates excellent test-retest reliability, hence supporting its use as a measure of hip muscle function. Application of this measure can assist clinicians such as sports physicians, orthopaedic surgeons, and physiotherapists with clinical examination of injuries associated with hip muscle function, exercise prescription, and the monitoring of strength changes associated with intervention. Furthermore, this protocol offers a reliable means of measuring strength deficits and therefore injury risk as well as a reliable means of measuring performance at a strength-based level in sports where hip muscle function is important.

Future Directions

This study has established a reliable strength testing protocol for the assessment of strength of all six hip muscle groups. In contrast to previous methods, the protocol offers positions, which aim to maximise subject stability to allow the tester to counteract both the magnitude and direction of force produced by the hip musculature.

Acknowledgements

The authors wish to acknowledge Saunders Sports and Spinal for the use of their facilities for subject testing.

Conflicts of Interest

There are no conflicts of interest to declare.

References

[1] Lawrence R, Kernozek T, Miller E, Torry M, Reuteman P. Influence of hip external rotation strength on knee mechanics during single leg drop landings in females. Clin Biomech. 2008;23(6):806-13.

[2] Steultjens M, Dekker J, van Baar M, Oostendorp R, Bijlsma J. Muscle strength, pain and disability in patients with osteoarthritis. Clin Rehabil. 2001;15:331-41.

[3] Rasch A, Bystrom A, Dalen N, Berg H. Reduced muscle radiological density, cross-sectional area, and strenght of major hip and knee muscles in 22 patients with hip osteoarthritis. Acta Orthop. 2007;78:505-10.

[4] Ireland M, Wilson J, Ballantyne B, McClay Davis I. Hip strength in females with and without patellofemoral pain. J Orthop Sports Phys Ther. 2003;33:671-6.

[5] Cichanowski H, Schmitt J, Johnson R, Niemuth P. Hip strength in collegiate female athletes with patellofemoral pain. Med Sci Sports Exerc. 2007;39(8):1227-32.

[6] Friel K, McLean N, Myers C, Caceres M. Ipsilateral hip abductor weakness after inversion ankle sprain. J Athl Train. 2006;41(1):74-8.

[7] Fredericson M, Cookingham C, Chaudhari A, Dowdell B, Oestreicher N, Sahrmann S. Hip abductor weakness in distance runners with iliotibial band syndrome. Clin J Sport Med. 2000;10:169-75.

[8] Tyler T, Nicholas S, Campbell R, Donellan S, McHugh M. The effectiveness of a preseason exercise program to prevent adductor muscle strains in proffesional ice hockey players. Am J Sports Med. 2002;30(5):680-3.

[9] Hewett T, Stroupe A, Nance T, Noyes F. Plyometric training in female athletes: decreased impact forces and increased hamstring torques. Am J Sports Med. 1996;24(6):765-73.

[10] Kendall F, McCreary E, Provance P, Rodgers M, Romani W. Muscles: Testing and function with posture and pain. 5th ed. Philadelphia: Lippincott Williams & Wilkins; 2005.

[11] Arokoski M, Arakoski J, Haara M, Kankaanpaa M, Vesterinen M, Niemitukia L, et al. Hip muscle strength and muscle cross sectional area in men with and without hip osteoarthritis. J Rheumatol. 2002;29:2185-95.

[12] Nadler S, Malanga G, Deprince M, Stitik T, Feinberg J. The relationship between lower extremity injury, low back pain, and hip muscle strength in male and female collegiate athletes. Clin J Sport Med. 2000;10:89-97.

[13] Bruton A, Conway J, Holgate S. Reliability: what is it, and how is it measured? Physiotherapy. 2000;86(2):94-9.

[14] Weir J. Quantifying test-retest reliability using the intraclass correlation coefficient and the SEM. J Strength Cond Res. 2005;19(1):231-40.

[15] Bennell K, Hunt M, Wrigley T, Hunter D, Hinman R. The effects of hip muscle strengthening on knee load, pain and function in people with knee osteoarthritis: a protocol for a randomised, single-blind controlled trial. BMC Musculoskelet Disord. 2007;8(121):1-9.

[16] Pua YH, Wrigley T, Cowan S, Bennell K. Intrarater test-retest reliability of hip range of motion and hip muscle strength measurements in persons with hip osteoarthritis. Arch Phys Med Rehabil. 2008;89:1146-54.

[17] Andrews A, Thomas M, Bohannon R. Normative values for isometric muscle force measurements obtained with hand-held dynamometers. Phys Ther. 1996;76(3):248-59.

[18] Bohannon R. Reference values for extremity muscle strength obtained by hand-held dynamometry from adults aged 20-79 years. Arch Phys Med Rehab. 1997;78:26-32.

[19] Scott D, Bond Q, Ann SS, Nadler S. The intra and interrater reliability of hip muscle strength assessments using handheld versus portable a dynamometer anchoring system. Arch Phys Med Rehab. 2004;85:598-603.

[20] Fulcher M, Hanna C, Elley C. Reliability of handheld dynamometry in assessment of hip strength in adult male football players. J Sci Med Sport. 2010;13:80-4.

[21] Niemuth P, Johnson R, Myers M, Thieman T. Hip muscle weakness and overuse injuries in recreational runners. Clin J Sport Med. 2004;15:14-21.

[22] Thorborg K, Petersen J, Magnusson S, Holmich P. Clinical assessment of hip strength using a hand-held dynamometer is reliable. Scand J Med Sci Sports. 2010;20:493-501.

[23] Wikholm J, Bohannon R. Hand-held dynamometer measurements: tester strength makes a difference. J Orthop Sports Phys Ther. 1991;13(4):191-8.

[24] AIHW. The active Australia survey. 2003.

[25] Beattie P, Isaacson K, Riddle D, Rothstein J. Validity of derived measurements of leg length differences obtained by use of a tape measure. Phys Ther. 1990;70(3):1-8.

[26] Jaric S. Muscle strength testing: use of normalisation for body size. Sports Med. 2002;32(10):615-31.

[27] Perkins D, Wilson G, Kerr J. The effects of elevated arousal and mood on maximal strength performance in athletes. J Appl Sports Psychol. 2001;13:239-59.

[28] Nadler S, Malanga G, Solomon J, Feinberg J, Foye P, Park Y. The relationship between lower extremity injury and the hip abductor to extensor strength ratio in collegiate athletes. J Back Musculoskelet Rehabil. 2002;16:153-8.

[29] Atkinson G, Nevill A. Statistical methods for assessing measurement error (reliability in variables relevant to sports medicine. Sports Med. 1998;4:217-38.

[30] Shrout P, Fleiss J. Intraclass correlations: uses in assessing reliability. Psychol Bull. 1979;86:420-8.

[31] Yen M, Lo LH. Examining test-retest reliability: An intra-class correlation approach. Nurs Res. 2002;51(1):59-62.

[32] Martin H, Yule V, Syddall H, Dennison E, Cooper C, Sayer A. Is hand-held dynamometry useful for the measurement of quadriceps strength in older people? A comparison with the gold standard biodex dynamometry. Gerontology. 2006;52.

Categories
Original Research Articles

Comparison study of two methods of identifying the adrenal glands on Computed Tomography (CT)

Background: The adrenal glands (AG) are common sites for metastases in cancer patients. Identification of the AG on computed tomography (CT) is complicated by surrounding anatomical structures of similar radiological density, and may be difficult for non-radiologists.
Aim: This study compared the accuracy of two landmarks commonly used to identify the AG on CT.
Methods: 1,112 consecutive patients attending a comprehensive cancer centre received CT scans of their abdomen or chest over a one-month period. Scans were retrospectively analysed on a PACS workstation by a radiologist. The distance between the AG and two easily identifiable CT landmarks were measured. The landmarks included the upper pole of the kidneys (UP) and the coeliac axis (CA).
Results: CT scans were analysed to find the distance (using axial slices) between the AG and the landmarks. When they occurred on the same slice, the distance was given a value of zero. The CA and the right AG occurred at the same level in 65% of patients, and the CA and the left AG in 88% of patients. For the right UP, the right AG was at the same level in 42% of patients; and the left UP, at the same level as the left AG in 58% (p<0.001). The mean distance of the CA from the right and left AG was 4.45±7.14 mm and 1.15±3.59 mm respectively. The right and left UP were at a mean distance of 8.05±9.42 mm and -4.30±5.94 mm respectively from the AG. Paired t-test showed a significant correlational difference between the CA and UP as landmarks for the AG (p<0.0001). Conclusion: This study showed that the CA was closer to the AG than the UP. The CA may provide an accurate landmark for identification of the AG on CT scans.

Introduction

Comparison study of two methods of identifying the adrenal glands on computed tomography
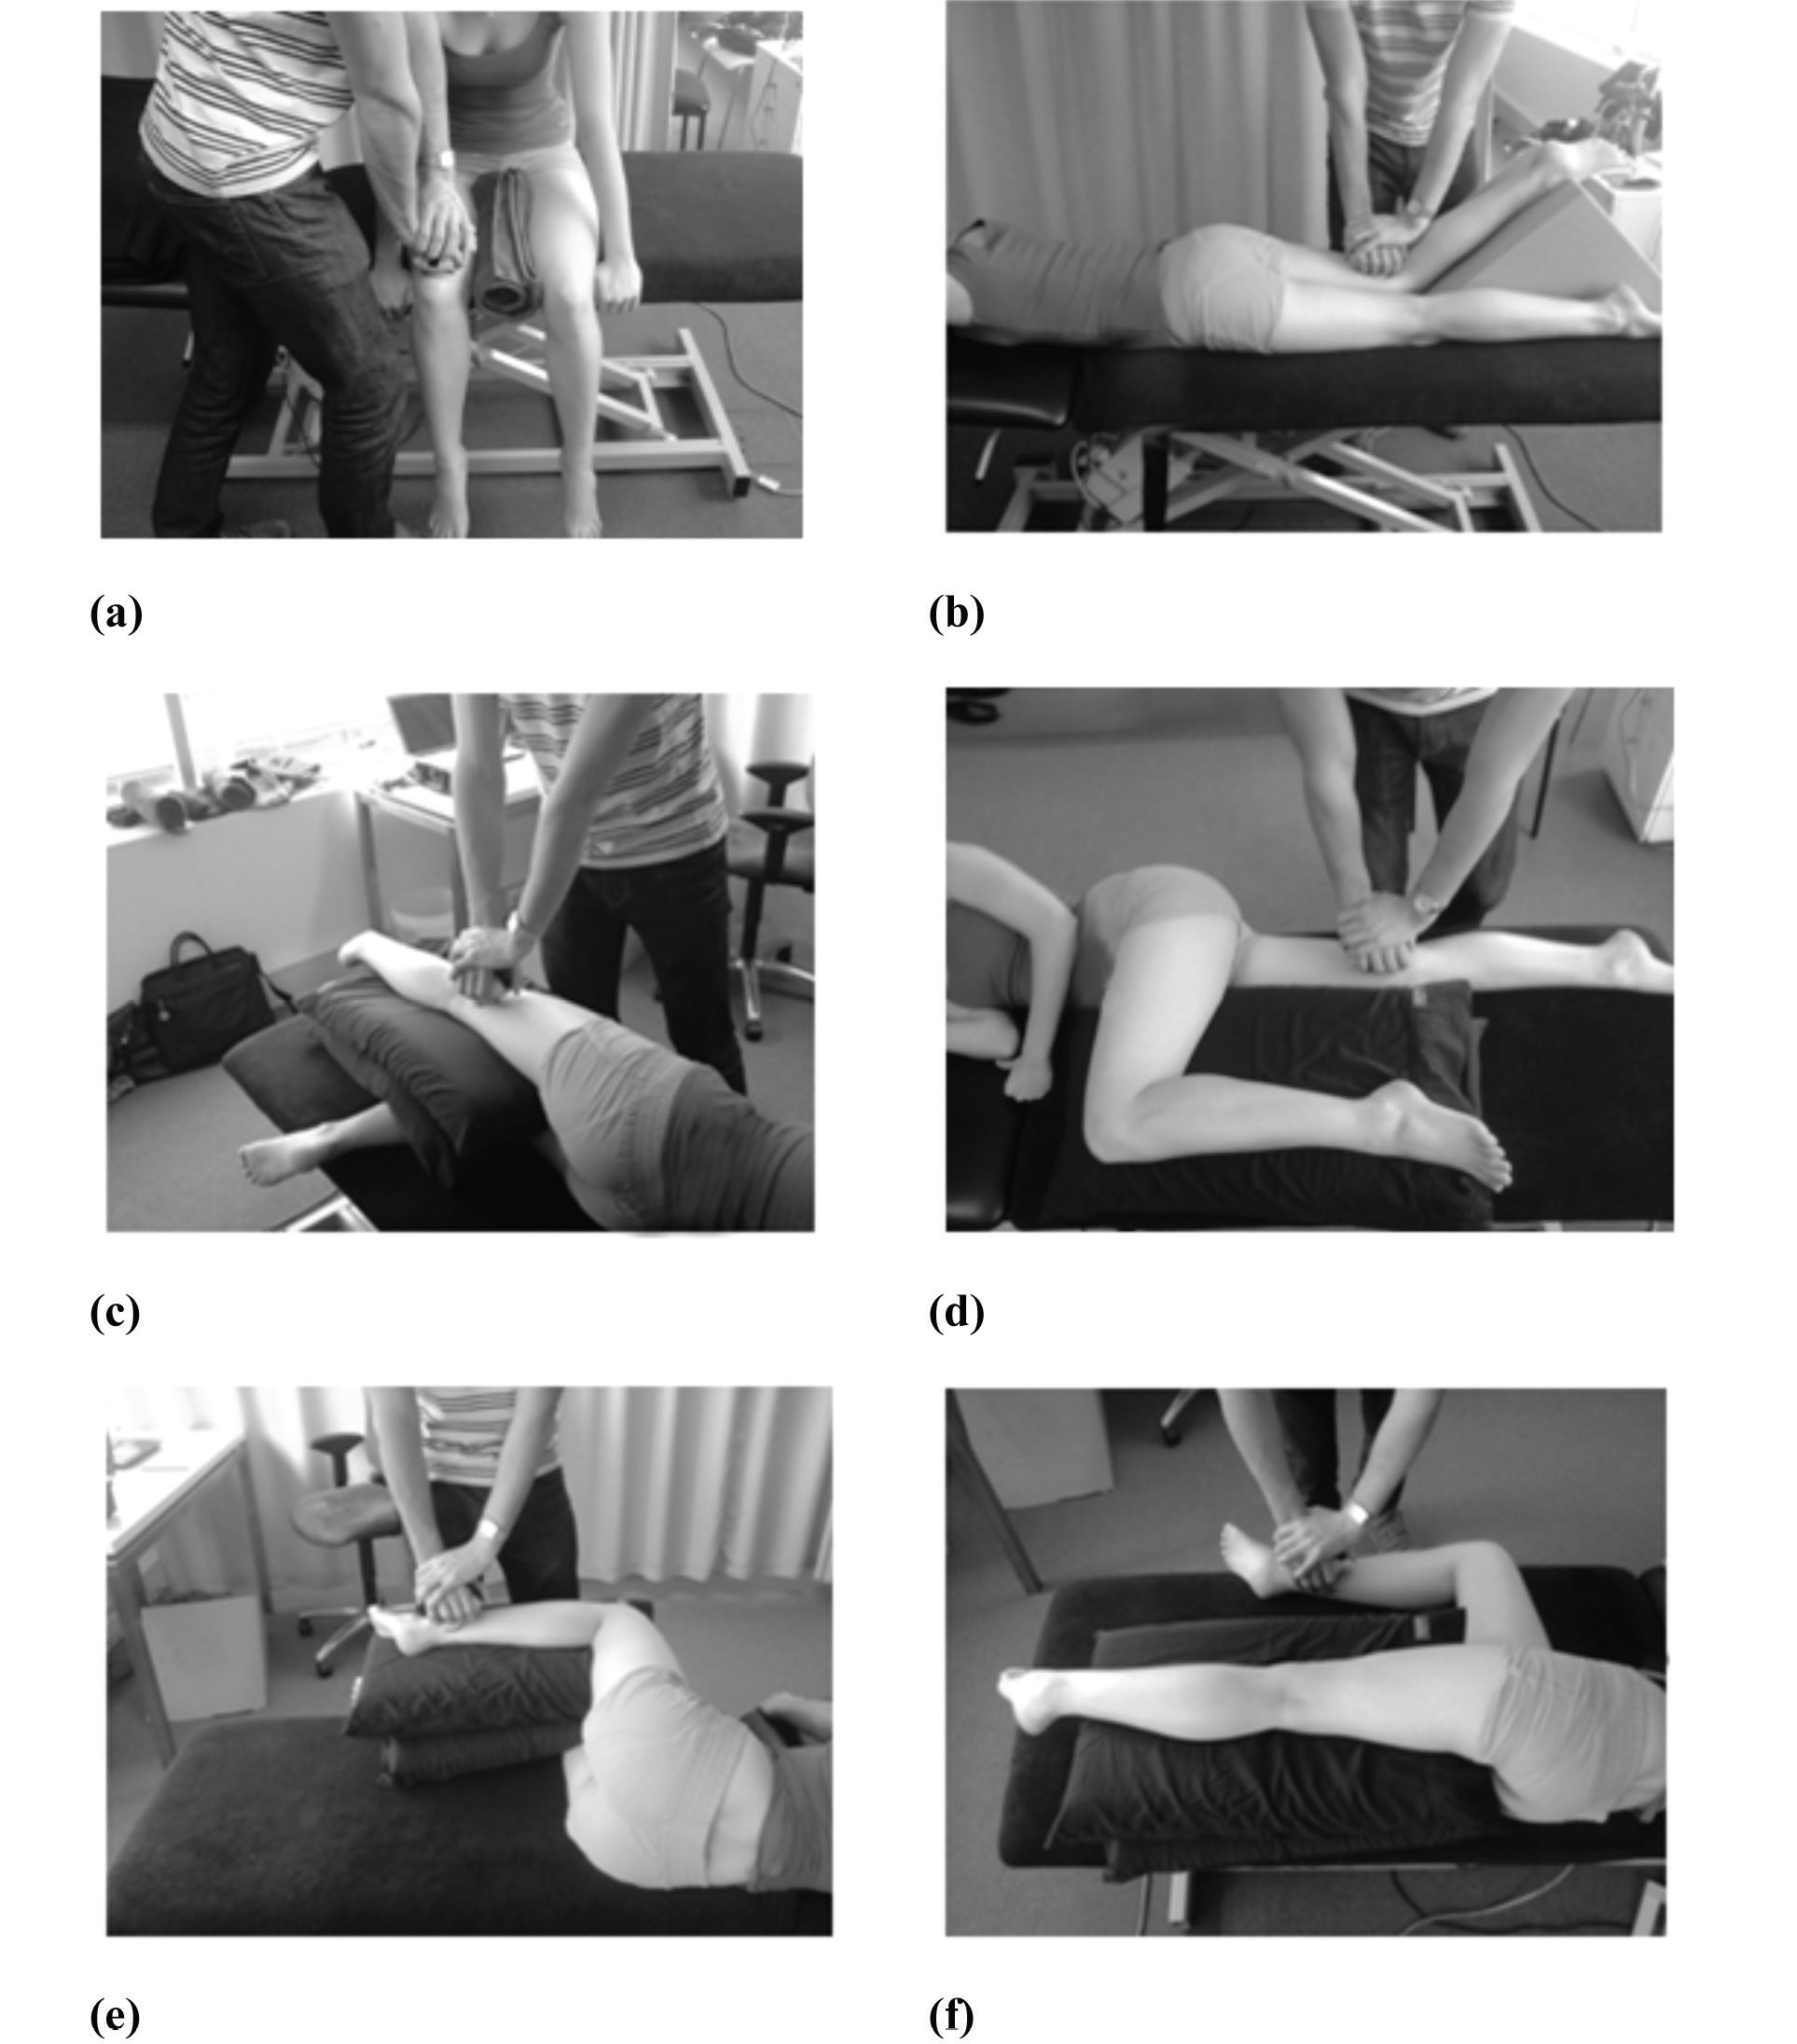
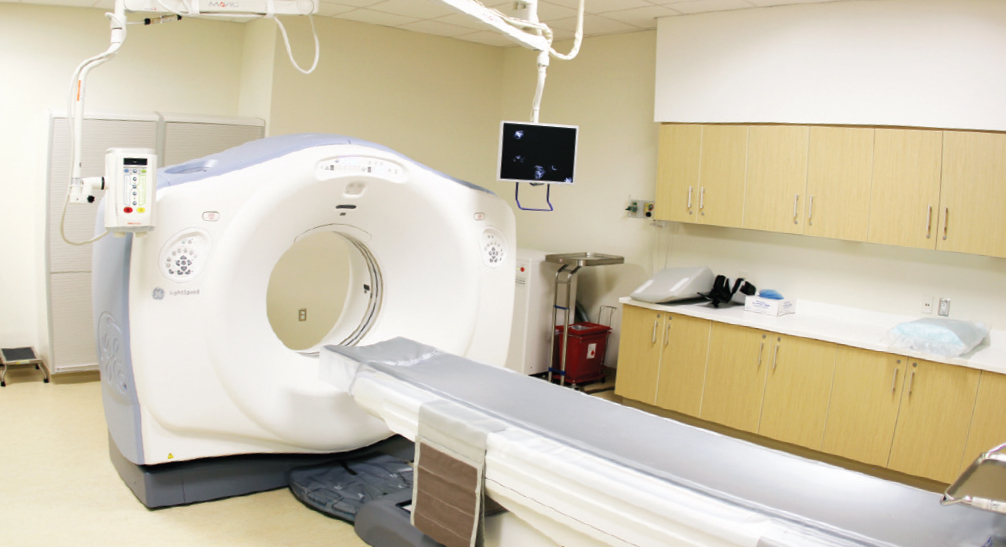
The adrenal glands (AG), locoregional lymph nodes, and the liver are common sites of metastases in cancer patients, with more than half of adult malignancies from renal cell carcinomas affecting the AG. [1-3] The majority of AG metastases are identified on computed tomography (CT) imaging. [1,4-8] Occasionally, one may encounter primary adrenal tumours such as adrenal adenomas and rarely, adrenal carcinomas. [3,6] It is important for clinicians to be able to accurately identify the AG in cancer patients to allow early identification and subsequent management of metastases. [9-12] As there are often delays in the time for CT scans to be assessed by a radiologist, early diagnosis of adrenal metastases by physicians may be of benefit in terms of earlier treatment and cost savings. [4,13] Furthermore, physicians who are able to quickly identify adrenal lesions on CT and provide detailed information to their patients in clinic may aid their patients in the understanding of their illness. This may potentially improve treatment outcomes, especially for patients with metastatic cancer. [13-16]
Identification of the AG on CT can be difficult for a number of reasons. Firstly, surrounding anatomical structures can complicate the diagnosis of adrenal lesions by superimposing upon the AG, or mimicking an adrenal mass (pseudotumour). [1-4,7] Secondly, the AG may cover the upper pole of the kidneys (UP) or be pressed up against the crus of the diaphragm. [17] Thirdly, the AG may move with respiration, making them more difficult to identify without a stable landmark. [9,18,19] Finally, a paucity of intra-abdominal fat can hinder identification of the AG. Generally, the right AG is easier to identify than the left AG owing to its different anatomy and surrounding structures. [20]
There is limited research available to compare the different methods for identifying the AG. [7,12] Known methods use different landmarks: most commonly the UP and possibly the coeliac axis (CA). [18,21] These landmarks are used to aid in the identification of the AG, and are especially useful for medical professionals not trained in cross-sectional radiography. [1,12] While the UP are frequently used landmarks, [18,21] the CA, a major branch of the abdominal aorta that gives rise to the hepatic and gastric arteries, is suggested to be an accurate landmark as it is present in most patients. [22,23] Although the hepatic and gastric branches move with respiration, the origin of the CA (which comes off the aorta) demonstrates minimal movement with respiration. It is currently unclear whether the CA is an accurate landmark for identification of the AG. Accordingly, we conducted a cross-sectional study with the aim of comparing the distances of the CA and UP from the AG on CT scans.

Methods

Patient Population

Consecutive patients (n=1,112) attending a comprehensive cancer centre over a one-month period underwent CT scans of their abdomen or chest as part of their routine medical management. CT images and clinical data were reviewed retrospectively in accordance with Institutional Review Board (IRB) and ethics approval. Patients were excluded if they had medical conditions that were thought to significantly alter the location of the AG (n=75). This included patients with surgery adjacent to the AG (n=9), splenomegaly (n=1), renal lesions (n=27), massive adrenal nodules (n=7) and massive adrenal metastases (n=31). Patients who had not received IV contrast (n=74) were not excluded from the study.

CT acquisition and analysis

Patients were scanned on a LightSpeed © 64-Slice VCT CT system, manufactured by GE Healthcare (Little Chalfont, Buckinghamshire, UK). Contiguous axial 0.6 mm slices were obtained and the images were reconstructed at 5 mm intervals for viewing on a Carestream PACS v10.2 workstation (Carestream Health, Rochester, NY, USA). All images were reviewed by a radiologist with over 20 years of experience in cross-sectional imaging.
Two methods were studied to determine the more effective method of land marking and identifying the AG. The first and more commonly known method involved the identification of the UP, following it slice by slice superiorly until reaching the mid-level of the AG. The second method employed the CA, as the landmark (Figure 1.A). [22] For this study, the mid-level of the AG was identified, and its position was noted in relation to the upper margin of the respective UP and to the CA. Distances between the AG and landmarks were calculated by counting the number of axial slices between the structures and converting this to millimetres (craniocaudal distance). Each CT DICOM had a slice thickness of 5 mm (Table 1). A distance of 0 mm indicated that the landmark and AG were present on the same slice. Positive values indicated the AG were superior to the landmark and negative values indicated that the AG were inferior to the landmark.

Figure 1.a. A CT scan reveals the coeliac axis (CA) on the same slice (and level) to the right (R.AG) and left adrenal gland (L.AG).
Figure 1.b. A CT scan that demonstrates the tail of the pancreas (PT) interfering with the left adrenal gland (L.AG) and the right adrenal gland is absent from the image.

Statistical analysis

Results were analysed using IBM SPSS ® version 20 (Armonk, NY, USA). The distance between the AG and the defined landmarks were compared using paired t-tests. A p-value of <0.05 was considered to be statistically significant. Results

In total there were 1,037 patients with a median age of 60 years (Inter-quartile range: 52-68 years) and male to female ratio of 527:510. Twelve (1.2%) of the patients in the study had non-massive adrenal lesions and 74 (7.1%) of the patients had not received IV contrast. The images without IV contrast were scrutinised in greater depth because it was more difficult to distinguish the CA on non-contrast CT, but it did not markedly affect the identification of normal AG. [12,21,24] The results below provide an overview of the relational distance between AG and landmarks, calculated by slice levels that were numbered and converted to millimetres (Table 1). Graphical representation of the mean distances of the AG to the landmarks are shown in Figure 2. Statistical assessment of differences between landmarks are shown in Table 2 and Figure 3.

Table 1. A comparison of the distance between the adrenal glands and their respective landmarks (coeliac axis and upper poles of the kidney). IQR, inter-quartile range; CA, coeliac axis; UP, upper pole; AG, adrenal gland. * The number of cases in which the AG were on the same slice (0 mm, level=0) as the respective landmarks, with the valid percentage included. † Both the right and left AG and their joint relationship with the landmarks, CA and UP.
Table 1. A comparison of the distance between the adrenal glands and their respective landmarks (coeliac axis and upper poles of the kidney).
IQR, inter-quartile range; CA, coeliac axis; UP, upper pole; AG, adrenal gland.
* The number of cases in which the AG were on the same slice (0 mm, level=0) as the respective landmarks, with the valid percentage included.
† Both the right and left AG and their joint relationship with the landmarks, CA and UP.

Figure 2. A comparison of the mean absolute distance of the adrenal glands from the respective landmarks. The AG to CA (blue), and AG to UP (red).
Figure 2. A comparison of the mean absolute distance of the adrenal glands from the respective landmarks.
The AG to CA (blue), and AG to UP (red).

Table 2. Paired t-tests samples show a significant decrease in distance within individual patients when using the coeliac axis as a landmark.

Pair 1 is the comparison of the mean distance between the right adrenal gland and its landmarks, the coeliac axis and the upper pole of the right kidney. Pair 2 is the comparison of the mean distance between the left adrenal gland and its landmarks, the coeliac axis and the upper pole of the left kidney. Differences are expressed as mean and standard deviation.

Figure 3. Paired t-test analysis demonstrates significant difference between the adrenal glands and landmark, the means and 95% CI, 95% Confidence Interval of the Difference. The measurements for CA – Right UP (blue box) and CA – Left UP (red box) are shown in Table 2.

The CA and the right AG occurred at the same level in 65% of patients, and the CA and the left AG in 88% of patients. For the right UP, the right AG was at the same level in 42% of patients; and the left UP, at the same level as the left AG in 58% (p-value<0.001). The median distance for the CA to the right AG (0 mm) was less than the median distance between the right UP and right AG (5 mm). The left AG had the same median distance from the CA and the left UP (0 mm). The CA also had smaller interquartile ranges, 0 – 10 for the right AG and 0 – 0 for the left AG, compared to the UP with interquartile ranges, 0 – 15 for the right AG and 0 – 10 for the left AG. Pair 1 compared the right UP with the CA, and Pair 2 compared the left UP with the CA. Both Pair 1 (the distance of the right AG from the CA and right UP) and Pair 2 (the distance of the left AG from the CA and left UP) indicated that the CA distance to AG was closer to 0 mm than the UP distances to AG (p<0.0001; Table 2). Discussion

The main finding of this study was that the AG could be more accurately identified on CT images when the CA was used as the reference landmark as opposed to the conventional method of using the UP as a landmark. The distance between the AG and the CA was significantly shorter than the distance between the AG and the UP. Furthermore, the CA was more likely to be located on the same axial slice as the left and right AG than the UP. This study also showed that the CA was a less variable landmark than the UP, with smaller interquartile ranges. These findings support the belief that the CA does not move with respiration, providing one explanation why the CA appeared to be a more accurate landmark.

Anatomical landmarks play an important role in medical imaging. Identifying a landmark proximal to the target organ can reduce distance-related errors that may occur when analysing CT images. [25] As Gunderman [26] said, “By far the most important role of imaging in the evaluation of the AG lies in the detection, characterization, and staging of adrenal tumours.” There are a limited number of studies available that explore different methods of identifying the AG, however, many studies have been undertaken assessing other radiological landmarks in the body. [7,12,27-31] For a landmark to be accurate, it must include the following general characteristics: Firstly, having a close measurable distance relationship to the target structure (preferably less than 10 mm). Secondly, the stability of the landmark should allow clinicians to accurately estimate the location of the target structure, and avoid the over- or underestimation of the target structure’s location from the landmark. [25,28-30] Thirdly, pattern approach CT imaging interpretation requires the more accurate landmark to be easily recognizable to the viewer. [28-32]

This study has several limitations. First, data was gathered from a sample of cancer patients, which is a subset of all patients that receive CT scans of the abdomen. Consequently, the results of this study may not be a true representation of the general population. Second, IV contrast was not administered to all 1,037 patients included and enhanced images may have allowed for easier identification of the CA. [12,21,24] Finally, CT images were analysed by an experienced academic radiologist. The findings may have been different had they been analysed by junior doctors or other non-radiologist physicians. This study could be improved by including a number of non-radiology clinicians as the primary readers. The data described here was from a cancer centre in Southeast Asia only. This study could be further improved with an international patient pool allowing comparison of different ethnic groups. Patients with massive renal and adrenal pathology, such as adrenal metastases, were excluded from the study. A larger study is required to investigate the impact of such pathology on the identification of AG on CT. Further research could be done to determine the possibility of reducing the time taken to identify and diagnose the status of the AG, when using the CA as a landmark. The technique of using the CA as a landmark may also be applied to the identification of primary or secondary carcinoma, and further study could aid with the locating and identification of abnormal AG.

Conclusion

The CA is an easily identifiable landmark that is closer to the adrenal gland than the UP. This landmark may be applied by clinicians to facilitate timely detection of the AG on CT scans.

Conflicts of Interest

None declared.

Acknowledgements

Professor John Morley and Associate Professor Noel Young for their assistance in proof-reading the abstract. Eric Martin and Diane Premnath for their patience and kindness in reviewing the paper. Jeremiah Schmidt for his aid with the statistics. Michelle Ng, Sophie Kobuch, Chatwin Lee, Lisa Leow, Corinne Fulford, Simon Chow, and Karlene Zhu for their patience in proof-reading the paper.

References

[ 1] Chabner BA, Thomas J. Lynch J, Longo DL. Harrison’s Manual of Oncology. 16th ed. Shanahan J, Davis KJ, editors. New York: McGraw-Hill Companies, Inc.; 2008. p. 345-356.

[ 2] Gokan T, Ohgiya Y, Nobusawa H, Munechika H. Commonly encountered adrenal pseudotumours on CT. Br J Radiol. 2005;78:170-4.

[ 3] Ma G, Liu SW, Zhao ZM, Lin XT, Lou L, Li ZP, et al. Sectional anatomy of the adrenal gland in the coronal plane. Surg Radiol Anat. 2008;30:271-80.

[ 4] Benitah N, Yeh BM, Qayyum A, Williams G, Breiman RS, Coakley FV. Minor morphologic abnormalities of adrenal glands at CT: prognostic importance in patients with lung cancer. Radiology. 2005;235(2):517-22.

[ 5] Boland G, Blake MA. Adrenal Imaging. Boston: Humana Press; 2009.

[ 6] Higham CE, Coen JJ, Boland GWL, Trainer PJ. The Adrenals in Oncology. In: Blake MA, Boland GWL, editors. Adrenal Imaging. Totowa: Humana Press Springer Science+Business Media; 2009. p. 65-76.

[ 7] Al-Hawary MM, Francis IR, Korobkin M. Adrenal Imaging Using Computed Tomography: Differentiation of Adenomas and Metastasis. In: Blake MA, Boland GWL, editors. Adrenal Imaging. Totowa: Humana Press, Springer Science+Business Media; 2009. p. 127-39.

[ 8] Grumbach MM, Biller BM, Braunstein GD, Campbell KK, Carney JA, Godley PA, et al. Management of the clinically inapparent adrenal mass (“incidentaloma”). Ann Intern Med. 2003;138(5):424-9.

[ 9] Ellis H, Logan BM, Dixon AK. Human Sectional Anatomy: Atlas of Body Sections, CT and MRI Images. Oxford: Butterworth Heinemann; 1999. p. 134-163.

[ 10] Johnson PT, Horton KM, Fishman EK. Adrenal mass imaging with multidetector CT: pathologic conditions, pearls, and pitfalls. Radiographics. 2009;29(5):1333-51.

[ 11] Arnold DT, Reed JB, Burt K. Evaluation and management of the incidental adrenal mass. Proc (Bayl Univ Med Cent). 2003;16:7-12.

[ 12] Ilias I, Sahdev A, Reznek RH, Grossman AB, Pacak K. The optimal imaging of adrenal tumours: a comparison of different methods. Endocr Relat Cancer. 2007;14(3):587-99.

[ 13] Abujudeh HH, Kaewlai R, McMahon PM, Binder W, Novelline RA, Gazelle GS, et al. Abdominopelvic CT increases diagnostic certainty and guides management decisions: A Prospective investigation of 584 patients in a large academic medical center. AJR Am J Roentgenol. 2011;196:238-43.

[ 14] Brundage MD, Feldman-Stewart D, Cosby R, Gregg R, Dixon P, Youssef Y, et al. Cancer patients’ attitudes toward treatment options for advanced non-small cell lung cancer: implications for patient education and decision support. Patient Educ Couns. 2001;45(2):149-57.

[ 15] Leydon GM, Boulton M, Moynihan C, Jones A, Mossman J, Boudioni M, et al. Cancer patients’ information needs and information seeking behaviour: in depth interview study. BMJ. 2000;320(7239):909-13.

[ 16] Silvestri G, Pritchard R, Welch HG. Preferences for chemotherapy in patients with advanced non-small cell lung cancer: descriptive study based on scripted interviews. BMJ. 1998;317(7161):771-5.

[ 17] Ellis H, Mahadevan V. Clinical Anatomy: Applied Anatomy for Students and Junior Doctors. Tweleth Edition ed. Chichester: Wiley-Blackwell; 2010. p. 61-168.

[ 18] Johnson PT, Horton KM, Fishman EK. Adrenal imaging with multidetector CT: evidence-based protocol optimization and interpretative practice. Radiographics. 2009;29(5):1319-31.

[ 19] Mayo-Smith WW, Boland GW, Noto RB, Lee MJ. State-of-the-art adrenal imaging. Radiographics. 2001;21(4):995-1012.

[ 20] Welch TJ, Sheedy SP, II PFS. Adrenal Glands. In: Haaga JR, Dogra VS, Forsting M, Gilkeson RC, Ha HK, Sundaram M, editors. CT and MRI of the Whole Body. 5 ed. Philadelphia: Mosby Elseiver; 2009. p. 1813-62.

[ 21] Kawashima A, Sandler CM, Fishman EK, Charnsangavej C, Yasumori K, Honda H, et al. Spectrum of CT findings in nonmalignant disease of the adrenal gland. Radiographics. 1998;18(2):393-412.

[ 22] Henry G. Gray’s Anatomy: The Anatomical Basis of Medicine and Surgery. 38th ed. Williams PL, editor. New York: Churchill Livingstone; 1995.

[ 23] Özbülbül NI. CT angiography of the celiac trunk: anatomy, variants and pathologic findings. Diagn Interv Radiol. 2011;17:150-7.

[ 24] Boland GW, Blake MA, Hahn PF, Mayo-Smith WW. Incidental adrenal lesions: principles, techniques, and algorithms for imaging characterization. Radiology. 2008;249(3):756-75.

[ 25] Nemoto M, Masutani Y, Hanaoka S, Nomura Y, Miki S, Yoshikawa T, et al., editors. Coarse-to-fine localization of anatomical landmarks in CT images based on multi-scale local appearance and rotation-invariant spatial landmark distribution model. Proc SPIE Medical Imaging: International Society for Optics and Photonics 8669; 2013.

[ 26] Gunderman RB. Essential Radiology. New York: Thieme Medical Publishers; 1998. p. 261-264

[ 27] Boland GW. Adrenal imaging: why, when, what, and how? Part 1. Why and when to image? AJR Am J Roentgenol. 2010;195(6):377-81.

[ 28] Aronson D, Kier R. CT pelvimetry: the foveae are not an accurate landmark for the level of the ischial spines. AJR Am J Roentgenol. 1991;156(3):527-30.

[ 29] Connor SE, Arscott T, Berry J, Greene L, O’Gorman R. Precision and accuracy of low-dose CT protocols in the evaluation of skull landmarks. Dentomaxillofac Radiol. 2007;36(5):270-6.

[ 30] Lou L, Lagravere MO, Compton S, Major PW, Flores-Mir C. Accuracy of measurements and reliability of landmark identification with computed tomography (CT) techniques in the maxillofacial area: a systematic review. Oral Surg Oral Med Oral Pathol. 2007;104(3):402-11.

[ 31] Karthikeyan D, Chegu D. CT Abdomen: A Pattern Approach: Jaypee Brothers Medical Publishers; 2007. p. 222-231

[ 32] Macari M, Megibow AJ, Balthazar EJ. A Pattern Approach to the Abnormal Small Bowel: Observations at MDCT and CT Enterography. AJR Am J Roentgenol. 2007;188(5):1344-55.

Categories
Case Reports

Medication-induced acute angle-closure glaucoma: a case study

Acute angle-closure glaucoma, is an uncommon condition. It is an emergency associated with the potential for significant vision loss and unilateral blindness if not diagnosed and treated promptly. This case describes a classic presentation of angle-closure glaucoma, highlighting the potential of certain medications to precipitate acute angle-closure glaucoma in at-risk individuals. Although the incidence is uncertain, it is thought that a significant number of cases may be medication-induced, and so it is important to be aware of what medications may precipitate acute angle-closure and have a plan for assessing and managing this small but real risk. In addition, patients should be warned of possible ocular symptoms and advised to seek urgent medical attention if they occur. In a presentation of acute angle-closure glaucoma, the key management is urgent reduction of intraocular pressure and ophthalmology referral

Case

A 65-year-old female presented to her general practitioner with a painful, red left eye associated with blurred vision and nausea. She had commenced paroxetine for management of depression three weeks prior. On examination, best-corrected visual acuity was 6/19 in the left eye, 6/6 in the right. The left pupil was mid-dilated and fixed. Examination was otherwise normal. An urgent ophthalmology review was organised and a diagnosis of acute angle-closure glaucoma was made.

Though uncommon in Australia, acute angle-closure glaucoma (AACG) is a medical emergency that requires rapid diagnosis and reduction of intraocular pressure to prevent permanent vision loss. [1,2]

Discussion

Epidemiology

Glaucoma is the second leading cause of vision loss worldwide, with an estimated 79.6 million people to be affected in 2020. Though approximately 74% of cases worldwide are open-angle glaucoma, it is projected that 5.3 million people will be legally blind due to AACC in 2020, comparable to the 5.9 million estimated to be blind due to open-angle glaucoma. [2]

Pathogenesis

Overwhelmingly, the most common cause of angle closure crisis is pupillary block. Aqueous humour normally flows between the pupil and lens, from the posterior chamber to the angle of the anterior chamber of the eye, where it then drains across the trabecular meshwork. When the pathway between the lens and iris is blocked, aqueous accumulates behind the iris, pushing it anteriorly and blocking the trabecular meshwork, thus preventing aqueous drainage. [3] When this occurs, intraocular pressure (IOP) rapidly becomes elevated, frequently reaching pressures greater than 60 mmHg, rapidly causing glaucomatous optic neuropathy if untreated. [4] Eyes with pre-existing anatomic narrow angles are predisposed to acute angle-closure.

Medication-induced angle-closure

Medication-induced angle-closure has been reported to cause a significant proportion of AACC cases in developed countries. [5] Consequently, it is important to be aware of the risk when prescribing implicated medications. The underlying mechanism may be due to pupil dilatation (mydriasis) as a medication side effect, or due to choroidal effusion, causing swelling of the ciliary body and forward movement of the lens and iris towards the chamber angle. [4,6]

Ophthalmic mydriatics are a well-known precipitant of angle-closure crisis, but other medications with mydriatic effects also carry risk. Importantly, this includes several classes of antidepressants: selective-serotonin reuptake inhibitors (SSRIs), tricyclic antidepressants and serotonin–noradrenaline reuptake inhibitors. [7] Visual disturbance has frequently been a cause of SSRI withdrawal and it has been suggested that SSRI-induced intraocular pressure elevation may be underestimated. [8]

Any medication with sympathetic or anticholinergic effects has theoretical potential to precipitate angle-closure in at-risk eyes. Other drugs implicated include phenothiazine antipsychotics, antihistamines, benzhexol, over-the-counter medications containing phenylephrine, nebulised ipratropium bromide and salbutamol. [4,9]

Topiramate, an anticonvulsant commonly used to treat epilepsy and for migraine prophylaxis, has commonly been reported as a precipitant of AACC in the literature due to choroidal effusion. A report suggested topiramate may be the most common cause of AACC in individuals under the age of 40. [11] The risk is thought to be due to the sulfur component of the drug. Other sulfur-containing medications, including acetazolamide, have been reported as precipitants, though only rarely, so should therefore not be used to treat topiramate-induced angle-closure. [6,9,10]

Drug-induced acute angle-closure usually develops soon after initiation of treatment, and generally within 30 days. Whilst AACC classically presents with a unilateral red eye with pain and reduced vision, bilateral presentations may occur and are more common in medication-induced cases. If symptoms are consistent with angle-closure crisis, a high index of suspicion must be maintained. [11,12]

Clinical implications

Clinicians should be aware of medications associated with increased risk of angle-closure glaucoma, and consider and warn the patient of this small possibility when initiating these medications. [13] The risk of causing angle-closure when dilating pupils is very low (estimated 1 in 20 000) and mydriatics should always be used when performing a complete fundus examination. A good choice of medication to minimise risk is tropicamide 0.5%. [14]

It would be impractical for an ophthalmologist to review every patient before prescribing many of the associated medications, however, a brief history of ocular symptoms should be taken and the risk profile of the patient stratified. [9]

Acute angle-closure risk factors include:

  • Advanced age
  • Asian ethnicity
  • Severe hyperopia (beware of the patient wearing thick glasses)
  • Known shallow anterior chamber, or occludable angle
  • Family history of blindness suspicious for angle-closure glaucoma

The oblique flashlight test, a simple way to estimate anterior chamber depth, should be performed (Figure 1). A light is shined onto the temporal iris. If the anterior chamber is deep, the iris will be uniformly illuminated. Shadowing of the nasal iris indicates the anterior chamber may be shallow, increasing risk of anterior chamber angle occlusion. The test is only 45.5% specific, but is 82.7–91.7% sensitive and may be performed rapidly. [15,16]

Figure 1. Oblique Flashlight Test. Uniform illumination of the iris indicates a deep anterior chamber
Figure 1. Oblique Flashlight Test. Uniform illumination of the iris indicates a
deep anterior chamber

Patients should be warned of ocular symptoms and their significance at first prescription of implicated medications, particularly if identified to be at high risk. If at high risk, an ophthalmology referral should be considered to evaluate the degree of openness of the angle that is prone to angle-closure. [9,13] On review after initiating implicated medications, it is important to ask patients whether they have experienced any ocular symptoms. [17]

It is important to note that open-angle glaucoma is a separate condition and patients with this condition should not be denied medications associated with angle-closure glaucoma. [18]

Treating angle-closure glaucoma

Immediate treatment goals are rapid reduction of intraocular pressure and symptomatic relief. Intravenous mannitol 5–10 mL/kg of 20% solution, given over 30 minutes, will cause a rapid, temporary reduction in intraocular pressure. [19] Intravenous or oral acetazolamide may also be required. Topical medications, including timolol, prednisolone, and brimonidine, may be used. [10] A miotic, such as pilocarpine, is used to constrict the pupil. This will pull the peripheral iris away from the angle, thereby opening drainage through the trabecular meshwork. Antiemetics and analgesics should be given as needed, and the patient should be supine, in an attempt to prevent further anterior movement of the lens. Any medications possibly contributing should be ceased. [5,12]

Definitive treatment is laser iridotomy, performed by an ophthalmologist. An opening is made in the peripheral iris, allowing free flow of aqueous between posterior and anterior chambers, allowing equilibration of pressure between the chambers, thus preventing the occurrence of pupillary block. Both eyes are treated, even in unilateral presentations, as the fellow eye is likely to have the same narrowed angles, which increases the risk of angle-closure. [3,11]

Consent

Informed consent was obtained from the patient for publication of this case report. Informed consent was obtained from individuals photographed for the purposes of this report.

Conflict of Interest

None declared.

References

[1] Wensor M, McCarty C, Stanislavsky Y, Livingston P, Taylor H. The prevalence of glaucoma in the Melbourne Visual Impairment Project. Ophthalmology. 1998;105(4):733-9.

[2] Quigley H, Broman A. The number of people with glaucoma worldwide in 2010 and 2020. Brit J Ophthalmol. 2006;90(3):262-7.

[3] Masselos K, Bank A, Francis IC, Stapleton F. Corneal indentation in the early management of acute angle closure. Ophthalmology. 2009;116(1):25-9.

[4] Subak-Sharpe I, Low S, Nolan W, Foster PJ. Pharmacological and environmental factors in primary angle-closure glaucoma. Brit Med Bull. 2010;93:125-43.

[5] Lachkar Y, Bouassida W. Drug-induced acute angle closure glaucoma. Curr Opin Ophthalmol. 2007;18(2):129-33.

[6] Chen T, Chao C, Sorkin J. Topiramate induced myopic shift and angle closure glaucoma. Brit J Ophthalmol. 2003;87(5):648-9.

[7] de Guzman M, Thiagalingam S, Ong P, Goldberg I. Bilateral acute angle closure caused by supraciliary effusions associated with venlafaxine intake. Med J Australia. 2005;182(3):121-3.

[8] Costagliola C, Parmeggiani F, Sebastiani A. SSRIs and intraocular pressure modifications: evidence, therapeutic implications and possible mechanisms. CNS drugs. 2004;18(8):475-84.

[9] Razeghinejad M, Pro M, Katz L. Non-steroidal drug-induced glaucoma. Eye (Lond). 2011;25(8):971-80.

[10] Ybarra M, Rosenbaum T. Typical migraine or ophthalmologic emergency? Am J Emerg Med. 2012;30(5):831.

[11] Pokhrel P, Loftus S. Ocular emergencies. Am Fam Physician. 2007;76(6):829-36.

[12] Amerasinghe N, Aung T. Angle-closure: risk factors, diagnosis and treatment. Prog Brain Res. 2008;173:31-45.

[13] Cackett P. Funduscopy: to dilate or not? Other drugs can cause partial pupil dilatation. Brit Med J. 2006;332(7534):179.

[14] Liew G, Mitchell P, Wang JJ, Wong TY. Fundoscopy: to dilate or not to dilate? Brit Med J. 2006;332(7532):3.

[15] Yu Q, Xu J, Zhu S, Liu Q. A role of oblique flashlight test in screening for primary angle closure glaucoma. Yan Ke Xue Bao. 1995;11(4):177-9.

[16] He M, Huang W, Friedman D, Wu C, Zheng Y, Foster P. Slit lamp-simulated oblique flashlight test in the detection of narrow angles in Chinese eyes: the Liwan eye study. Invest Ophth Vis Sci. 2007;48(12):5459-63.

[17] Lai J, Gangwani R. Medication-induced acute angle closure attack. Hong Kong Med J. 2012;18(2):139-45.

[18] Razeghinejad M, Myers J, Katz L. Iatrogenic glaucoma secondary to medications. Am J Med. 2011;124(1):20-5.

[19] Mannitol. Australian Medicines Handbook [internet]. 2013 [cited 2014 March 1] Available from: http://www.amh.net.au/online/

Categories
Guest Articles

Minding the mental in health…

“There is no health without mental health”—David Satcher, US Surgeon General, 1999

Professor Patrick McGorry, AO, MD, PhD, FRCP, FRANZCPAs Australia’s future doctors, you are facing the challenges of finishing your training and establishing yourself within your chosen career pathway in a profession that offers unique opportunities, but also significant stressors, all at a uniquely vulnerable time of life. Many of the stressors associated with a career in medicine have a disproportionate impact on students and junior doctors. These include the high workloads and demanding training requirements—often within difficult clinical environments—that young doctors face in the early stages of their careers, along with the need to find a balance between the demands of professional and personal responsibilities, among other others. In this context then, it should come as no surprise that medical students, and doctors, report substantially higher rates of psychological distress and suicidality than other professionals, or the general public.

The recent national survey of doctors’ and medical students’ mental health by beyondblue presents some sobering statistics; but first, some crucial demographic data. [1] The majority (80%) of the 6,658 medical students who took part in the survey were under 25 years of age, with 32.5 % in the preclinical and 67.5% in the clinical stages of their training. Strong epidemiological data tells us that 75% of those who suffer from a mental illness experience their first episode by the age of 25 years, with a peak in new onsets in the late teens and early twenties. [2, 3] Thus, most medical students, along with other tertiary students, are in the peak age group in terms of risk for developing mental ill-health.

Disturbingly, 9.2% of medical students reported very high levels of psychological distress, a rate double that of intern doctors (4.4%) and triple that of the general population (3.1%). Rates of depression and anxiety were also significantly higher in medical students than the general population, but similar to those in the broader university student population. Of even greater concern, the rate of suicidal ideation and suicide attempts by medical students was almost ten-fold higher than those of the general population, with almost one in five medical students reporting thoughts of suicide and approximately 4% an actual suicide attempt within the last year. [1]

Clearly, medical students are not immune from mental ill-health: this should come as no surprise, given our developing understanding of the chronology and epidemiology of the mental illnesses. Adolescence and early adulthood—better described as emerging adulthood—is a time of great developmental significance, when young people are establishing their psychological, social, and vocational identities and pathways as part of the transition to independent adulthood. [4] This transition occurs against the background of the highly dynamic changes in brain architecture that occur at this time of life, driven by a series of maturational processes that result in the refinement of the neuronal circuitry and a recalibration of the inhibitory/excitatory balance, particularly in the frontal cortex. [5] Because these biological and social changes coincide, they combine to create a unique ‘window of vulnerability’ to the onset of mental illness.

Without doubt, undertaking the extremely demanding training that medical school requires contributes to the developmental and social stresses that impact all young people, and more so for those who are already vulnerable to mental ill-health. In this regard, the most commonly reported sources of stress for medical students were largely related to the demands of study, the university-related workload, conflict between study/career and family/personal relationships, keeping up to date with knowledge and fear of making mistakes. Along with their psychological symptoms, students also reported extremely high rates of burnout and exhaustion, with over half reporting emotional exhaustion, and around a quarter reporting high cynicism and low professional efficacy. [1]

Encouragingly, the majority of medical students (56%) who felt seriously depressed or who had received a diagnosis of depression sought treatment, while 40% of those who felt seriously anxious or had been diagnosed with an anxiety disorder sought treatment. [1] These figures are almost double the national average for young people, [6] although they are in keeping with medical students’ status as a group that is aware of mental health issues. However, the fact that around half of those at least with a need for care are not seeking or accessing it. The nature and quality of such care is another issue altogether. The most common sources of professional help were GPs, followed by psychologists or counsellors, and then university counselling services, while family and friends were the most common personal sources of support. Significantly, the most common coping strategies used by students who felt anxious or depressed were positive, and the rates of harmful drinking were half that of their student peers, while other substance use rates were low. While many medical students do seek help for mental health concerns, and at higher rates than their peers, only 20% of students reported feeling comfortable this, with almost half the cohort citing embarrassment, fears regarding confidentiality/privacy or not wanting help from others as the main barriers to seeking help. [1] The level of engagement seems poor and the skill levels of the professionals remains unclear.

This brings me to the crux of this article: stigma and the lack of parity between physical and mental health care. Would 80% of young people—medical students or not—feel uncomfortable about seeking care for a physical ailment, say a broken bone, or diabetes, or flu? I strongly suspect not. Stigma is institutionalised in our health care system from the level of funding—although mental illness accounts for 13% of the burden of disease in Australia, mental health care receives about 7.7% of the total health budget [7]—to the quality of physical and mental health care that those with serious mental illness receive. [8] The ‘lethal discrimination’ that results in those with serious mental illness dying on average 20 years earlier than their peers, largely as a result of cardiovascular disease or suicide, is an ongoing disgrace that we are yet to address. [9]

The beyondblue report presents some very disturbing statistics on medical students’ attitudes to doctors with mental health issues that are particularly salient here. Medical students believed that the medical community holds stigmatising attitudes towards doctors with a mental illness, with approximately 50% of students reporting the belief that doctors considered that experiencing depression or anxiety was a sign of personal weakness, while 41.5% believed that doctors with a history of depression or anxiety were less likely to be appointed. Even more disturbing was the fact that 60% of medical students with a current diagnosis felt that other doctors thought less of doctors who have experienced depression or anxiety, and over half thought that doctors with a mental health history were less competent than doctors with no history of mental illness. [1] This endemic stigma within the medical profession affects not only the way we interact with colleagues who are experiencing mental health issues, but also our patients. It also acts a major barrier to help-seeking among students who worry not only about their self-image but also their future prospects and reputation.

What are the lessons to learn here? Firstly, and as the report recommends, a wider discussion needs to be held about doctors’ mental health and wellbeing within the medical community. Education is the key to reducing stigma, and better education regarding the prevalence of mental health issues within the medical community and the importance of seeking help early is an excellent first step here. Why should seeking help for a mental health complaint be any different to seeking help for a physical illness, even for doctors? Vulnerability is after all part of what makes us human, and often makes us better doctors. Recognising our own vulnerability to mental health issues will enable us to better recognise our patients’ difficulties and deal with them constructively. Normalising, rather than stigmatising, mental illness is the first step towards parity in health care. With the lifetime prevalence of mental ill-health approaching 50%, [2] mental health issues, just like physical health problems are hard to avoid, are after all very ‘normal’ as a challenge to be faced, and will touch almost all of us at some point.

In concrete terms, what can we do to address the immediate issues? Firstly, training could also be provided regarding stress minimisation and positive coping strategies, from medical school on, and all doctors and medical students should be encouraged to have their own youth-friendly GP outside their workplace setting to minimise concerns over privacy and confidentiality, as well as self-prescribing. Secondly, issues related to workplace stress need to be addressed. This will involve reducing the workload expected of doctors, particularly junior staff who are still in training, and promoting a better work-life balance. Extra support and expert clinical care for those who are struggling, either through specific mental health services, supportive mentoring, and training in stress management, could also be provided. Thirdly, medical students themselves have shown great leadership in getting this issue on the agenda and should be heavily involved in a redesign of student health and mental health care on campuses around Australia. Tertiary students in general report significantly higher rates of mental ill-health than their age matched peers, [10] and hence the tertiary sector and government has a serious responsibility to provide health services that appeal to students and that recognise their needs, including their mental health care needs.
As Australia’s doctors of the future, you have the opportunity to help move our health care system out of the past and into the present; firstly, by valuing your own mental wellbeing, and that of your colleagues. Recognising the importance of mental health to overall wellbeing is central to providing quality health care, and is a long overdue step that we need to take on the road to system reform.

Conflict of interest

None declared.

Correspondence

P McGorry: pmcgorry@unimelb.edu.au

References

[1] beyondblue. National mental health survey of doctors and medical students. Melbourne: beyondblue, 2013.

[2] Kessler RC, Berglund P, Demler O, Jin R, Merikangas KR, Walters EE. Lifetime prevalence and age-of-onset distributions of DSM-IV disorders in the National Comorbidity Survey Replication. Arch Gen Psychiatry. 2005;62(6):593-602.

[3] McGorry PD, Purcell R, Goldstone S, Amminger GP. Age of onset and timing of treatment for mental and substance use disorders: implications for preventive intervention strategies and models of care. Curr Opin Psychiatry. 2011;24(4):301-6.

[4] Arnett JJ. Emerging adulthood. The winding road from the late teens through the twenties. New York: Oxford University Press; 2004.

[5] Paus T, Keshavan M, Giedd JN. Why do many psychiatric disorders emerge during adolescence? Nat Rev. 2008;9(12):947-57.

[6] Slade T, Johnston A, Teesson M, Whiteford H, Burgess P, Pirkis J, et al. The mental health of Australians 2: Report on the 2007 National Survey of Mental Health and Wellbeing. Canberra: Department of Health and Ageing, 2009.

[7] Hughes M. Equity and parity of service provision is essential to transforming the lives of those with mental ill health. Crikey. 2014 Apr 29; Available from: http://blogs.crikey.com.au/croakey/2014/04/09/equity-and-parity-of-service-provision-is-essential-to-transforming-the-lives-of-those-with-mental-ill-health/.

[8] Morgan VA, McGrath JJ, Jablensky A, Badcock JC, Waterreus A, Bush R, et al. Psychosis prevalence and physical, metabolic and cognitive co-morbidity: data from the second Australian national survey of psychosis. Psychol Med. Dec 2013:1-14.

[9] Thornicroft G. Physical health disparities and mental illness: the scandal of premature mortality. Br J Psychiatry. 2011;199(6):441-2.

[10] Stallman HM. Psychological distress in university students: A comparison with general population data. Aust Psychologist. 2010;45(4):249-57.

Categories
Guest Articles

Days of miracle and wonder

Source: ww.sydney.edu.au
My youngest son, James, is an undergraduate in his third year at the University of Sydney. His world is more like yours, dear reader, than mine. It differs from mine in the depth of experience and knowledge he has acquired at a young age, his international travel formerly for music and now for debating, his less guilt-ridden ethics, and his friends’ and his own profound concerns about the future of the planet. These differences distinguish him from me even now, but more dramatically, they separate us, especially when I compare his life at present with what mine was like as a serious young medical student in the 1960s. Search as I might, I can find nothing – not a thing – that marks out my experience in my twenties as superior to his.

The outstanding technological advances that form our environment are based largely upon information science. James and his friends are in constant contact electronically as I guess you are with your colleagues. Information communication technology revolutionises teaching and learning: Who knows where massive open online courses (MOOCs) will lead us? And it has been a revolution.

Imagine this: When I moved from Newcastle University to the gigantic Westmead Hospital in 1986, I asked for a fax machine for our Department of Community Medicine that I was then to direct. The hospital authorities questioned my request because, they said, “there is already a fax in the hospital.” Debate was occurring as to whether a big central computer was the way to go or whether we would support desktops. Now the paperless hospital is upon us. This was not many years ago: in functional terms it feels like a century.

This new electronically-informed and supported environment has its problems, one of them being information overload. This year, The Medical Journal of Australia is celebrating its centenary and in defining its future we must take into account the avalanche of information, comprised of original studies, syntheses, synopses (Cochrane Reviews) and computerised decision support systems. The sheer volume of information means that new skills are needed to navigate through, and around, the avalanche in search of signs of life. Journals such as yours and ours must respond. As I wrote in the centenary editorial, the amount of information we generate each day is stupendous:

Given the exponential rate of electronic evolution, Eric Schmidt, executive chairman of Google, claimed that humans now create as much information every 48 hours as we made from the dawn of civilisation to 2003 – that’s 5 exabytes of data, or five billion gigabytes, in 2 days.

Where can we go for help? We must learn from radio astronomers who have wrestled with massive data sets and also from the stupendous advances occurring in the management of big data by enterprises such as Google. Big data can yield astonishing results, reducing the need for sampling when conducting population studies, providing rapid answers to questions about infectious disease transmission and providing early warning of epidemics, for example. We will find our way, I am confident, but we will need to be active searchers.

J. Craig Venter, the leader of the private enterprise team that sequenced the human genome in parallel with Francis Collins and the publicly-funded team in 2001, has not slowed down and heads a major biotech company and institute in La Jolla, California. He depends heavily on ICT and sees the future of medical research to be completely intertwined with the future of information technology.

It is now possible, he has shown, to sequence the complete genome of a bacterium or fungus, reduce it to binary code, transmit it at the speed of light to another laboratory and synthesise a new genome from the data, insert it into a life form from which the genetic material has been removed and bingo! You have regenerated life. Hence the title of his recent book, Life at the Speed of Light.

Mars, Venter claims, has swapped lots of material with earth over the past millions of years, in the form of meteorites, and he reasons that life on the two planets may well have a common origin. He has a dramatic imagination. Here he promotes an idea that may become a reality during your lifetime.

Venter asks us to consider sending a rover to Mars capable of drilling to reach deep subterranean lakes. If analysis of the water yields a life form that contains genetic material, the rover, which is fitted with a genetic sequencer, would translate the genome into binary code and radio it back to Earth where the Martian bacterium, or whatever, would then be synthesised.

Think for a moment where you are with regard to the unravelling of dark medical mysteries such as dementia – you are so much further ahead than I was at your age and possess so much more scientific power to progress a positive, health-promoting agenda.

As singer Paul Simon says in his 1986 song, The Boy in the Bubble, “These are the days of miracle and wonder!” Old frontiers in medicine have disappeared; new horizons beckon. You are entering a fabulously exciting world. Make certain you document your progress and publish it – in your journal or ours!

Categories
Guest Articles

The future of Indigenous health in Australia

Source: www.aida.org.au
In 1866 the first Indigenous Canadian doctor completed her training and in 1899 the first Maori doctor graduated from medical school in the United States. Professor Helen Milroy, a founding member of the Australian Indigenous Doctors’ Association (AIDA), graduated from the University of Western Australia as Australia’s first Aboriginal doctor 84 years later in 1983. The number of Aboriginal and Torres Strait Islander medical graduates has increased to 180 with a further 261 Indigenous medical students studying at universities. In 2011 the intake of first year Indigenous medical students at Australian universities reached a new high of 2.5 per cent, matching the percentage of Australia’s Aboriginal and Torres Strait Islander population.

AIDA is the peak representative body for Indigenous doctors and medical students, and strives to achieve the vision of Aboriginal and Torres Strait Islander people having equitable health and life outcomes. We do this by: providing a unique medical and cultural perspective on Aboriginal and Torres Strait Islander health; maintaining links between traditional and contemporary medicine; and growing and supporting current and future Aboriginal and Torres Strait Islander doctors. This vision is central to the work that AIDA undertakes and is embedded in our advocacy and policy work.

AIDA also recognises the role of traditional healers who preceded contemporary medicine and to this day still remain active in Aboriginal and Torres Strait Islander communities throughout Australia: “The knowledge, wisdom, and skill of our traditional healers is becoming increasingly recognised within Australia as well as internationally…not only for the direct benefit of the community but to ensure that health practitioners are being educated in understanding and working with traditional healers to improve physical health and mental health outcomes.” [1] We are proud to have a strong relationship with the traditional healers who act as teachers, guides and leaders to our organisation.

In order to consider the future of Indigenous health in Australia, it is imperative that all Australians understand the current health status of the population. In 2011 Aboriginal and Torres Strait Islander people comprised 2.5 per cent of the total Australian population, with 669,736 people recorded in the 2011 census. [2,3] New South Wales had the largest Indigenous population (208,364) and Northern Territory had the highest proportion of Indigenous people (29.8 per cent), with the majority of Aboriginal and Torres Strait Islander people living in major cities. [3] A major observation in the Australian Demographic Statistics was that in 2011 one third of the Indigenous population were aged 15 years or below and only four per cent were above the age of 65. [2] The Aboriginal and Torres Strait Islander population is younger and dying earlier compared with our non-Indigenous counterparts. The life expectancy for Aboriginal and Torres Strait Islander peoples was estimated to be 11.5 years lower than that of the non-Indigenous populations for males (67.2 compared with 78.7 years) and 9.7 years lower for females (72.9 compared with 82.6 years). [4] The leading causes of Aboriginal and Torres Strait Islander deaths in 2006-2010 were cardiovascular disease (including heart attacks and stroke), cancer, and injury/trauma (including transport accidents and self-harm). [4] Also, the incidence of type II diabetes has risen exponentially, leading to various chronic health issues in communities. It is also important to note that 75 per cent of the deaths mentioned previously are preventable, therefore it is achievable to alter the statistics for the better. [4]

The inequality of health in Australia was brought to the wider public’s attention by the former Aboriginal and Torres Strait Islander Social Justice Commissioner, Dr Tom Calma AO, in the 2005 Social Justice Report. Subsequent to this report the Close the Gap Coalition was formed and the Close the Gap Campaign was launched. Close the Gap has raised the awareness of Indigenous health to all Australians and provides an opportunity for individuals to advocate for improvements in health. AIDA is a member of the Close the Gap Steering Committee and is also a signatory of the Close the Gap: Statement of Intent (2008) between the Australian Government, the opposition party, and peak Indigenous and non-Indigenous organisations. [1] To ensure targets within the Statement of Intent are achieved there need to be systematic processes to ensure Aboriginal and Torres Strait Islander people have control over their own health. An emphasis on Indigenous people being a part of the decision making process and having access to culturally safe health services are examples of such processes.

The Council of Australian Governments (COAG) has demonstrated support for the Close the Gap Campaign by keeping Indigenous health on the agenda of Commonwealth and State Governments. This commitment has led to the COAG Closing the Gap targets, they are: closing the life expectancy gap within a generation (by 2031); halving the gap in mortality rates for Indigenous children under five within a decade (by 2018); ensuring access to early childhood education for all Indigenous four year olds in remote communities within five years (by 2013); halving the gap in reading, writing, and numeracy achievements for children within a decade (by 2018); halving the gap for Indigenous students in year 12 attainment rates (by 2020); and halving the gap in employment outcomes between Indigenous and non-Indigenous Australians within a decade (by 2018). These targets highlight the importance of health, education, and employment all of which are crucial for improving the health and wellbeing outcomes of Aboriginal and Torres Strait Islander people.

Another critical factor in improving health outcomes for Indigenous people is an Aboriginal and Torres Strait Islander workforce. The Australian Human Rights Commission addressed this in a recent summit: “The Indigenous medical workforce is integral to ensuring that the health system has the capacity to address the needs of Aboriginal and Torres Strait Islander peoples. Indigenous health professionals can align their unique technical and sociocultural skills to: improve patient care; improve access to services; and ensure culturally appropriate care in the services that they and their non-Indigenous colleagues deliver.” [5] One approach AIDA is using to develop and strengthen an Indigenous medical workforce is building meaningful partnerships. The partnership approach should be based on mutual respect and commitment to joint-decision making, priority setting and constant learning, and reflection. An example of the partnership approach includes AIDA’s Collaboration Agreements established with the Medical Deans of Australia and New Zealand, the Confederation of Postgraduate Medical Educational Councils, and more recently with the Committee of Presidents of Medical Colleges. [6] Partnership with peak medical training organisations ensures that Indigenous health remains on the agenda across the medical training spectrum. The incorporation of outcomes in the Collaboration Agreements such as increasing the support for and retention rates of Indigenous medical students, trainees and fellows, and promoting medical education and training policy reform indicates a genuine commitment from the peak medical training bodies to support the Indigenous medical workforce at all levels. Building a culturally safe health workforce, both in numbers and competence, and culturally safe workplaces, are crucial to delivering high quality and sustainable health services to Indigenous people.

Although we must strive to ensure that the Indigenous medical workforce continues to grow, collaboration with and commitment from our non-Indigenous medical colleagues is vital if we are to improve the health status of Indigenous people. One example of collaboration between Indigenous and non-Indigenous health professionals is the Inala Indigenous Health Service Southern Queensland Centre of Excellence for Aboriginal and Torres Strait Islander Primary Health Care, in Brisbane, QLD. In 1994 the centre only had 12 Indigenous people registered as clients, since implementing a number of strategies informed by the local community; it now has 10,000 registered Indigenous patients, 8,000 of whom are regular users. Strategies implemented by the service include: employing more Indigenous staff; creating a culturally safe waiting room; staff cultural awareness training; disseminating information to the Indigenous community; and promoting intersectorial collaboration. [1] AIDA commends the work done by Associate Professor Noel Hayman and the team at Inala Indigenous Health Service Southern Queensland Centre of Excellence for Aboriginal and Torres Strait Islander Primary Health Care, for demonstrating effective collaboration and providing a good practice case study.

Partnership within the Indigenous health sector between peak health organisations is integral if we are to build strong and sustainable improvements in Indigenous health. AIDA is a member of the National Health Leadership Forum (NHLF), an entity within the National Congress of Australia’s First Peoples that involves the collaboration of peak Indigenous health organisations. The NHLF provides Indigenous leadership in the health sector and provides a strong voice to ensure that Aboriginal and Torres Strait Islander health remains on the agenda of Government. The NHLF is a strong example of how the strength of a collective can inform the development of collaborative policy, such as the 2013-2023 National Aboriginal and Torres Strait Islander Health Plan (“The Plan”), and more importantly advise and monitor the implementation of The Plan. [7]

Within the National Aboriginal and Torres Strait Islander Health Plan culture is central, and it is important to acknowledge and value the link between Indigenous culture, and health and wellbeing. The vision of The Plan is that ‘The Australian health system is free of racism and inequality, and all Aboriginal and Torres Strait Islander people have access to health services that are effective, high quality, appropriate and affordable.” Together with strategies to address social inequalities and determinants of health, this provides the necessary platform to realise health equality by 2031. [8]

Long term approaches to progressing improvements in Indigenous health need to also target the next generation of Indigenous health workforce with a focus on pathways into health careers for Indigenous youth. The age profile of the Aboriginal and Torres Strait Islander population is significantly younger than that of the non-Indigenous population. In 2011, around 36 per cent of the Indigenous population was aged less than 15 years, compared with 18 per cent of the non-Indigenous population. [9] With regards to the education attainment of Indigenous people, 25 per cent of the population had completed year 12, compared with 52 per cent of non-Indigenous people, and 4.6 per cent of Aboriginal and Torres Strait Islander people had achieved a bachelor level degree, compared to 20 per cent of non-Indigenous people. [9] If we are to develop an appropriate future Indigenous health workforce, greater attention will need to be given to developing the skills of the younger Aboriginal and Torres Strait Islander generation so that they are ready and able to pursue a career in the health sector.

In April this year, under the auspice of AIDA, and in partnership with the following peak Aboriginal and Torres Strait Islander health organisations: National Aboriginal Community Controlled Health Organisation; Indigenous Allied Health Australia; Congress of Aboriginal and Torres Strait Islander Nurses and Midwifes; National Aboriginal and Torres Strait Islander Health Worker Association; Indigenous Dentists’ Association Australia; and the Australian Indigenous Psychologists Association, the inaugural Murra Mullangari: Pathways Alive and Well Health Careers Development Program was launched. Murra Mullangari: Pathways Alive and Well is targeted at addressing a critical area of need in the health industry, which is engaging young people with health careers; with a specific focus on Aboriginal and Torres Strait Islander youth who have expressed an interest in establishing a career in this sector. The Murra Mullangari: Pathways Alive and Well Program involved two components, the first being a residential workshop, held in Canberra. This component saw 30 Indigenous secondary students experience university life, be advised on a range of health career prospects and hear first-hand from Indigenous health professionals across a variety of health disciplines. The second component involved mentoring for participants, who are matched with an Indigenous professional in the health career of their interest.

As future members of the medical profession we encourage all medical students to build their knowledge of, and engagement with, Aboriginal and Torres Strait Islander health. It is important to understand that cultural safety is not simply a module that can be completed as a part of your medical degree; it requires continuous learning and experience, maintenance of strong clinical skills, and the ability to understand patients holistically. This could be done through volunteering in Indigenous communities, placement at an Aboriginal Community Controlled Health Organisation, or associate membership with AIDA.

It is important to build on the momentum developed through key collaboration agreements such as AIDA’s agreements with the Medical Deans of Australia and New Zealand, Confederation of Postgraduate Medical Education Councils, and the Council of Presidents of Medical Colleges. These partnerships enable a continued focus on the recruitment, retention, and graduation of Indigenous medical students, alongside support for trainees and fellows which is critical for the development and retention of a strong Indigenous medical workforce.

The development of medical practitioners, Indigenous and non-Indigenous, who are culturally and clinically competent and passionate about social justice are integral to the health outcomes of Australia. The way you practice medicine in the future could facilitate generational change within the health sector and lead to health equity in Australia. This change could be you and your peer’s legacy; the only thing left to consider is what part you will play in delivery this outcome.

References

[1] Ngaanyatjarra Pitjantjatjara Yankunytjatjara (NPY) Women’s Council Aboriginal Corporation. Traditional healers of Central Australia: Ngangkari. Australia: Magabala Books; 2013.

[2] Australian Bureau of Statistics. Australian demographic statistics, March Quarter 2012. Canberra: Australian Bureau of Statistics; 2012.

[3] What details do we know about the Indigenous population? [Internet] 2013 Apr 10 [cited 2014 Sep 20]. Available from: http://www.healthinfonet.ecu.edu.au/health-facts/health-faqs/aboriginal-population.

[4] Australian Health Ministers’ Advisory Council. Aboriginal and Torres Strait Islander health performance framework: 2012 report. Canberra: Office for Aboriginal and Torres Strait Islander Health, Department of Health and Ageing; 2012.

[5] Australian Human Rights Commission. Close the gap: Indigenous health equality summit–statement of intent. Canberra: Australian Human Rights Commission 2008 Mar 20.

[6] Partnerships [Internet]. ACT: Australian Indigenous Doctors’ Association; 2013 Sep 11 [cited 2014 Sep 20]. Available from: http://www.aida.org.au/partnerships.aspx

[7] Hayman NE, White NE, Spurling GK. Improving Indigenous patients’ access to mainstream health services: the Inala experience. Med J Aust. 2009;190(10):604-6.

[8] Department of Health and Ageing. National Aboriginal and Torres Strait Islander health plan 2013-2023. Canberra; Department of Health and Ageing; 2013.

[9] Overview of Indigenous health status. [Internet] [cited 2013 Aug 7]. Available from: http://www.healthinfonet.ecu.edu.au/health-facts/overviews/the-context-of-indigenous-health.

Categories
Review Articles

Aripiprazole as first-line treatment of late-onset schizophrenia – a case report and literature review

Introduction: Guidelines for the first-line treatment for late-onset schizophrenia (LOS) in the elderly patient have not been established. The current recommended treatment of schizophrenia in younger age groups has been extrapolated to those in the older age groups. This report considers the effects of medication specific to this demographic.

Case study: BB, a 73-year-old male, presented to the Mental Health Unit following a request and recommendation in response to concerns from family and friends, with a history of increasing paranoia and paranoid delusions. He was managed under an involuntary treatment order and was prescribed aripiprazole 10 mg once daily.

Methods: A literature review was conducted using UpToDate, Medline, PsychOnline and Ovid databases with limits set to exclude articles that were not written in English, published before the year 2000 or which were not available as full text. Articles were found using a combination of the search terms “late onset schizophrenia”; “risperidone AND mechanism of action”; “aripiprazole AND mechanism of action”; “paraphrenia”; “schizophrenia AND Australian therapeutic guidelines”; and “atypical antipsychotics pharmacology”.

Results: The literature review confirmed the efficacy and safety of aripiprazole in the elderly patient with LOS. Studies identified fewer side effects with aripiprazole, such as cerebrovascular and cardiovascular events, than with risperidone. There were no studies identified that directly addressed the question of whether aripiprazole should be used as first-line management of LOS instead of risperidone.

Conclusion: Aripiprazole should be considered as first-line management for patients with late-onset schizophrenia.

Case study

Aripiprazole as first-line treatment of late-onset schizophrenia – a case report and literature reviewBB is a 73-year-old Caucasian male who presented to the Mental Health Unit (MHU) following a request and recommendation (under the Queensland Mental Health Act 2000) in response to concerns from family and friends. BB presented from a nursing home with paranoid delusions that incorporated persecutory themes with thoughts that the nursing staff were poisoning his food in order to kill him. He also presented with auditory hallucinations complaining of hearing people through a speaker telling him they were going to cut off his toes and genitals. BB expressed suicidal ideation to escape, however, no previous attempts at suicide or self-harm had been made. When BB was further questioned about a suicidal plan he stated that he would like to do it cleanly with towels around him so there was no mess but no instrument or method was established. There was no history of substance abuse.

BB is retired and lives in a nursing home. His wife died three years prior to this presentation.

On assessment, BB was well groomed, sitting on a hospital bed, clutching his legs in a curled up manner. Mr. BB maintained a paranoid and untrusting manner throughout the presentation, with poor eye contact. Therefore, rapport with mental health staff was difficult to establish. His speech was agitated and consistent with anxiety. Affect was restricted and he appeared apprehensive towards the interviewer. His mood was difficult to establish because of his paranoid state. He had no insight into his mental illness and judgement was poor. BB was assessed to have a moderate risk of violence.

A Mini-Mental State Examination was carried out on admission to the MHU. BB scored 30/30 and combined with further assessment in the MHU dementia-related psychosis was excluded.

BB had a one-week admission to the MHU four years previously following the death of his wife. He had neurovegetative symptoms: not eating or sleeping and not carrying out activities of daily living. He required diazepam to assist with sleep and a nasogastric tube for enteral feeding. He was later discharged with family support.

BB has a medical history of hypertension, dyslipidaemia and ischaemic cardiomyopathy.

After a request and recommendation for assessment, BB was diagnosed with late-onset schizophrenia in accordance with the Diagnostic and Statistical Manual of Mental Disorders, 4th Edition, Text Revision (DSM-IV-TR) criteria and managed under the Mental Health Act (involuntary treatment order) for three weeks for this presentation.

BB was commenced on aripiprazole 5 mg once daily (OD). His auditory hallucinations and paranoid delusions persisted with no reduction in their severity. Aripiprazole was then increased by 5 mg after four days until clinical improvement was achieved at 10 mg OD.

Throughout the admission, BB’s auditory hallucinations and paranoid delusions resolved significantly and there was an improvement in his mental state. Pharmacotherapy combined with repetitive cognitive assessment resulted in a good initial prognosis.

Following aripiprazole 10 mg daily for two weeks, BB reported no auditory hallucinations or paranoid delusions. There had been no side effects of aripiprazole. BB was discharged with aripiprazole 10 mg OD and returned to Old Persons’ Mental Health Services in the community for support.

Introduction

Schizophrenia is characterised by various symptoms including delusions, hallucinations, disorganised speech, grossly disorganised or catatonic behaviour and negative symptoms (including loss of motivation, poverty of words and affective flattening). [1,2]

The average age of onset of schizophrenia is 18 in men and 25 in women. Late-onset schizophrenia (LOS) is a separate category of patients whose onset is after 45. Very late-onset schizophrenia (VLOS) occurs after 60 years of age. Australian diagnostic criteria do not separate LOS and VLOS. [2] Therefore, in the case study, Mr. BB is diagnosed with LOS.

Late-onset cases present with some differences to early-onset schizophrenia. The clinical presentation of LOS includes more persecutory delusions and hallucination, as evident in the case study, and is less likely to include disorganised behaviour and negative symptoms. [1] LOS has been demonstrated to have an increased response to pharmacotherapy (anti-psychotics) in lower doses, resulting in an improvement in symptoms compared with early-onset schizophrenia. [2]

If smaller doses can be administered the possibility of side effects is reduced.

Aim

The current recommended treatment of schizophrenia in younger age groups has been extrapolated to those in the older age groups. This article is a review of the literature, supplemented with a case study, and outlines the evidence that is available for the effectiveness of aripiprazole as first-line management of LOS. Aripiprazole is compared with risperidone, which is the current first-line management for schizophrenia in the younger population. Risperidone has been used for this review rather than olanzapine and quetiapine as it is more frequently prescribed as initial management in the elderly population. [3]

Data collection

To address the management of LOS, a literature search was conducted using the search terms “late onset schizophrenia”; “risperidone AND mechanism of action”; “aripiprazole AND mechanism of action”; “paraphrenia”; “schizophrenia AND Australian therapeutic guidelines”; and “atypical antipsychotics pharmacology”. The databases UpToDate, Medline, PsychOnline and Ovid were used with limits set to only include articles written in English and available as full-text journals. Articles published before the year 2000 were excluded from this study. Articles including meta-analyses (Level I evidence) as well as randomised controlled trials (Level II Evidence) were reviewed. No study was found comparing the use of risperidone as first-line management for LOS with the use of aripiprazole.

Current first-line management

The Royal Australian and New Zealand College of Psychiatrists (RANZCP) Clinical Practice Guidelines for the treatment of schizophrenia (inclusive of LOS) and related disorders since 2005 include psychotherapy and pharmacotherapy. [3]

Guidelines for the introduction of pharmacotherapy recommend:

  • Notification of patients and families of the benefits and risks of drug therapy. Where it is not possible to fully discuss the choice of agent as is the case in most acute episodes, oral atypical agents are used. Risperidone, olanzapine and quetiapine are regarded as the treatments of choice in the first episode of psychosis. [3]
  • Evaluation of the efficacy of treatment subjectively as well as objectively by the clinician with regular Mental State Examinations and reviews of the patient. [3,4]
  • Titration of the dose of risperidone as appropriate for the patient. [5]

Discussion

Aripiprazole is the proposed first-line management of LOS versus risperidone.

Dosing

The recommended starting dose for aripiprazole is 10 mg to 15 mg OD. [6] Intramuscular injection has a therapeutic benefit from 10 mg to 30 mg. There is no evidence showing oral medication being more effective above 15 mg OD. It is advised that dose increases should not be more frequent than twice weekly as this is the time needed to achieve a steady state. [6] In contrast, recommended initial risperidone dosing is 2 mg with titration in increments of 1–2 mg per day as tolerated by the patient to a recommended dose of 4 to 8 mg. For schizophrenia, efficacy with risperidone has been evident from 4 mg to 16 mg.

Mechanism of action

Aripiprazole acts as a partial dopamine D2 receptor agonist in the limbic system. It also acts as a partial agonist at serotonin 5-HT1A receptors but an antagonist of 5-HT2A receptors. [6,10] This is compared with risperidone, which acts as a dopamine D2 antagonist and low-affinity antagonist of serotonin type 2 receptors. [5,8]

Efficacy

In review of the Cochrane database, aripiprazole was compared with other antipsychotics for schizophrenia. One hundred and seventy four randomised control trials (RCTs) were compared involving 17 244 participants. [10] The RCTs comparing aripiprazole against risperidone demonstrated an increase in efficacy through an improvement in mental state measured by the Brief Psychiatry Rating Scale when using aripiprazole. Additionally, for patients using aripiprazole there was also a significant increase in the quality of life. Despite these demonstrations of efficacy these RCTs do not compare the use of these medications in the elderly population, limiting their applicability to LOS.

Comparison of side effects

Aripiprazole has minimal extrapyramidal side effects. [11] Sedation is a dose-related side effect (most prominent at 30 mg) which seems to decrease with time. [7,12] Monitoring is important in the elderly because of the potential for increased falls and, subsequently, possible fractures and head injuries.

In several controlled trials aripiprazole-induced extrapyramidal side effects were reported to be reduced compared to dopamine antagonists such as risperidone. [13-16] However, aripiprazole-induced akathisia was reported as higher (approximately 20%) in patients with schizophrenia. Anticholinergic agents may be used to treat parkinsonism and dystonia but are ineffective in treating akathisia. Beta-blockers and benzodiazepines are effective in reducing akathisia.

Risperidone has been reported to have increased extrapyramidal side effects including parkinsonism, akathisia, dystonia and tremor. [5,16] Cerebrovascular side effects include stroke and altered cardiac conduction, potentially causing life-threatening arrhythmias. Nausea, constipation, dyspepsia, salivary hypersecretion, abdominal discomfort, and diarrhoea were also recorded. Prolactin inhibition may result in reduced libido, caused by reduction in levels of testosterone and oestrogen. In long-term therapy low testosterone and oestrogen levels may lead to osteoporosis, which is especially relevant for older adults.

It is important to note that there is an absence of controlled studies of risperidone in the elderly, thus making assessment of the LOS side-effect profile impossible. Nevertheless, based on the known side-effect profile of risperidone, it is contraindicated for Mr. BB with a medical history of hypertension, dyslipidaemia and ischaemic cardiomyopathy.

Table 1: Comparison of anti-psychotic medications. *PBS = Pharmaceutical Benefits Scheme

Conclusion

Aripiprazole should be considered as an option for the first-line pharmacotherapeutic management of LOS. In trials comparing aripiprazole against risperidone, aripiprazole has higher efficacy in the management of the symptoms associated with schizophrenia. Additionally, aripiprazole produces fewer cardiac conduction abnormalities, gastrointestinal side effects, and extrapyramidal side effects than risperidone. Consequently, those on aripiprazole have a reduced risk of cardiovascular and cerebrovascular events, both of which are more common in older age groups.

Despite the indirect evidence for the use of aripiprazole in LOS, there is a paucity of studies directly comparing aripiprazole and risperidone in LOS. Further controlled studies (ideally double-blinded, placebo-controlled) should be performed to assess the efficacy, side-effect profile and drug interactions in older-age patients.

Consent declaration

Informed consent was obtained from the patient for the original case report.

Conflict of interest

None declared.

Correspondence

Tasciana Gordon: tasciana.gordon@my.jcu.edu.au

References

1. American Psychiatric Association. Diagnostic and statistical manual of mental disorders. 4th ed. Text revision. Arlington, VA: American Psychiatric Publishing; 2000.

2. Bernard F, Buchanan R. Schizophrenia: clinical manifestations, course, assessment and diagnosis [Internet]. UpToDate; 2014 [updated 2013 July 26; cited 2013 June 20]. Available from: http://www.uptodate.com/contents/schizophrenia-clinical-manifestations-course-assessment-and-diagnosis.

3. RANZCP CPG. Royal Australian and New Zealand College of Psychiatrists clinical practice guidelines for the treatment of schizophrenia and related disorders. Aust N Z J Psychiatry. 2005;39:1-30.

4. Howard R, Rabins P, Seeman M. Late-onset schizophrenia and very-late-onset schizophrenia-like psychosis: an international consensus. Am J Psychiatry. 2000;157(2):172-8.

5. Lexicomp. Risperidone: patient drug information [Internet]. UpToDate; 2014 [cited 2013 June 20]. Available from: http://www.uptodate.com/contents/risperidone-patient-drug-information.

6. Lexicomp. Aripiprazole: drug information [Internet]. UpToDate; 2014 [cited 2013 June 20]. Available from: http://www.uptodate.com/contents/aripiprazole-patient-drug-information.

7. Lauriellow J, Campbell A. Pharmacotherapy for schizophrenia: long-acting injectable antipsychotic drugs [Internet]. UpToDate; 2013 [cited 2013 Oct 3]. Available from: http://www.uptodate.com/contents/pharmacotherapy-for-schizophrenia-long-acting-injectable-antipsychotic-drugs.

8. Davis J, Chen N. Clinical profile of an atypical antipsychotic: risperidone. Schizophr Bull. 2002;28(1):43-61.

9. Bahman S, Ghader Z. Side effects of risperidone. Life Sci. 2012;9(3):1463-7.

10. Khanna P, Suo T, Komossa K, Ma H, Rummel-Kluge C, El-Sayeh HG, et al. Aripiprazole versus other atypical antipsychotics for schizophrenia [Internet]. Cochrane Database of Systematic Reviews. John Wiley & Sons, Ltd; 1996 [cited 2014 Jul 11]. Available from: http://onlinelibrary.wiley.com/doi/10.1002/14651858.CD006569.pub5

11. Burris KD, Molski TF, Xu C, Ryan E, Tottori K, Kikuchi T, et al. Aripiprazole, a novel antipsychotic, is a high-affinity partial agonist at human dopamine D2 receptors. J Pharmacol Exp Ther. 2002;302(1):381-9.

12. Mamo D, Graff A. Aripiprazole’s receptor pharmacology and extrapyramidal side effects. Am J Psychiatry. 2008;165(1):398.

13. Sweeney EB, Lawlor BA. Case series: extrapyramidal symptoms associated with use of aripiprazole in older adults. Int J Geriatr Psych. 2013;28:1208-10.

14. Coley K, Scipio T, Ruby C, Lenze E, Fabian T. Aripiprazole prescribing patterns and side effects in elderly psychiatric inpatients. J Psychiatr Pract. 2009;15(2):150-3.

15. Takahashi H, Oshimo T, Ishigooka J. Efficacy and tolerability of aripiprazole in first-episode drug-naïve patients with schizophrenia: an open-label trial. Clin Neuropharmacol. 2009;32(3):149-50.

16. Kim C, Chung S, Lee JN. A 12-week, naturalistic switch study of the efficacy and tolerability of aripiprazole in stable outpatients with schizophrenia or schizoaffective disorder. Int Clin Psychopharm. 2009;24(4):181-8.

Categories
Review Articles

Resistance to epidermal growth factor receptor inhibitors in non-small cell lung cancer and strategies to overcome it

The War on Cancer has been a particularly long, drawn-out one ever since the National Cancer Act was put into legislation by then U.S. President Richard Nixon. While we attempt to reveal the mechanisms that sustain the uncontrolled growth of cancer cells, the biology of cancer constantly changes and adapts to evade our treatment modalities. The discovery of imatinib, which is a tyrosine kinase inhibitor (TKI) and treats a subset of chronic myelogenous leukaemia, heralded a new generation of drugs that would specifically target cancer cells and reduce toxicity to normal cells. Erlotinib and gefitinib are two epidermal growth factor receptor (EGFR) TKI’s that have been developed for the treatment of patients with EGFR-mutation-expressing non-small cell lung carcinoma. However, in recent years, resistance to EGFR TKIs has been described in the literature. While the promise of a new treatment modality has been short-lived, this has also sparked interest and research efforts to understand the mechanisms of resistance to EGFR TKIs in a bid to discover strategies to overcome them and to further drug development. Well studied mechanisms include T790M mutation, loss of balance in the PI3K/Akt/mTOR pathway and MET amplification amongst many others. This article reviews the current literature regarding various mechanisms of resistance to EGFR TKIs and their potential for translation into new therapeutic agents and treatment strategies.

Background

Resistance to epidermal growth factor receptor inhibitors in non-small cell lung cancer and strategies to overcome itOne famous discovery of a targeted drug treatment is imatinib, a tyrosine kinase inhibitor (TKI) used to treat a subset of chronic myelogenous leukaemia expressing the Philadelphia chromosome. This discovery has triggered a series of research efforts, shedding light on topics such as tumourigenesis and cell signaling pathways, leading to the development of many new drugs which target these specific mechanisms. However, it has been documented that resistance to these drugs can develop, therefore reducing their treatment potential [1,2] This is also true for a similar group of TKIs known as epidermal growth factor receptor (EGFR) inhibitors, which have been used as part of the treatment regime for a subgroup of lung cancer patients with non-small cell lung carcinoma. This article will review the mechanisms of intrinsic and acquired resistance to EGFR inhibitors and strategies to overcome them.

Introduction to EGFR inhibitors

The work of Stanley Cohen and Rita Levi-Montalcini in Epidermal Growth Factors has revolutionized cancer research and treatment, having been awarded the 1986 Nobel Prize for Medicine. [3] Their work has triggered further research, eventuating into the approval of gefitinib in 2003 and erlotinib in 2010 by the Food and Drug Administration (FDA) for use in patients with NSCLC. [4-6]

The overexpression and over-activation of EGFR (independent of any ligands) has been found to be involved in the tumour progression of many different types of cancers. [7] Aberrant activation of this oncogene leads to a cascade of complex downstream signaling that contributes to tumourigenesis. [8] The understanding of EGFR’s role in tumourigenesis assisted in the development of gefitinib and erlotinib as first generation TKIs to target and block EGFR activity to retard cancer growth. They bind reversibly to the ATP binding pocket of EGFR, preventing receptor phosphorylation and subsequent downstream intracellular signaling. [6,8] There is evidence to suggest that EGFR TKIs have led to significant extension of progression-free survival as a second or third line treatment in patients with advanced NSCLC with positive EGFR status. [6,9,10] Promising results have also emerged in recent years for the use of EGFR TKIs as first line treatment for NSCLC patients exhibiting EGFR mutations in Phase III trials. [10-13]
Lung cancer is the 5th most commonly diagnosed cancer in Australia with poor 5-year survival rates of around 14%. [14] Specifically, NSCLC accounts for 60% of all cases of lung cancer. [15] According to the guidelines for lung cancer treatment in Australia, the role of EGFR TKIs (erlotinib), remains primarily in the treatment of Stage IV inoperable NSCLC. [16] It is not recommended for first-generation EGFR TKIs like gefitinib or erlotinib to be used in combination with standard chemotherapy regimens. Erlotinib plays more of a role as a first-line maintenance therapy after standard chemotherapy, as a second-line therapy instead of chemotherapy or as a third-line therapy after having failed two lines of treatment and for patients with poor performance status.
In 2010, Jackman et al. proposed a definition of acquired resistance to EGFR inhibitors to help standardize investigations into this topic. [17] They have found that about 70% of NSCLC patients with positive EGFR mutation status will experience tumour regressions whilst on either gefitinib or erlotinib. However, most initial responders develop acquired resistance to EGFR TKIs, [6] usually occurring about after 12 months of treatment. [18,19] Therefore, much effort has been dedicated to understanding and rediscovering the different mechanisms of EGFR inhibitor resistance-both intrinsic and acquired-in order to develop strategies to overcome them.

Areas of interest

There are numerous hypotheses as to how NSCLC patients develop resistance to EGFR TKIs. However, mechanisms of EGFR TKI resistance that have been more extensively studied and show the most potential for translation into clinical practice will be highlighted in this article.

T790M – The ‘gatekeeper mutation’

The mechanism of resistance that is most commonly identified in recent work is an acquired mutation in the EGFR gene at position 790 (T790M) in exon 20. This involves a threonine to methionine substitution and it is present in 50% of patients with acquired resistance to EGFR TKIs. [6,7,9,20] This substitution mutation causes steric interference with the binding of EGFR TKIs to the ATP binding site. [21] It is also hypothesized that this mutation leads to increased ATP affinity, conferring drug resistance. [6,21] This allows for phosphorylation of EGFR despite the administration of TKIs due to its restored affinity for ATP, allowing the cancer cell to grow unchecked once again with the restoration of EGFR activation. Of interest, some studies have found T790M mutations occurring at low frequency in the germ line of TKI-naive patients, [6,22,23] indicating potential intrinsic resistance. This mutation can also be found in NSCLC patients expressing wild-type EGFR before treatment, possibly explaining that the T790M mutation may be a contributing factor to intrinsic resistance to TKIs. [7]

Figure 1. T790M driven drug resistance and mechanism of action of different generations of EGFR TKIs.

Loss of PTEN expression and PIK3CA mutation in the PI3K/Akt/mTOR pathway

A complex network of signaling pathways interacting via various molecules are involved in cancer cell growth independent of EGFR activity. These signaling pathways are usually downstream of an EGFR and can potentially bypass loss of EGFR activation due to administration of TKIs such as gefitinib and erlotinib. One important pathway is the PI3K/Akt/mTOR signaling pathway. Sustained activation of Akt can potentiate resistance to chemotherapy and radiotherapy in general. [24,25] For EGFR-expressing NSCLC patients, Akt is strongly activated to maintain the survival of cancer cells. Activation of Akt always involves membrane recruitment for phosphate transfer. This is regulated positively by phosphoinositol-3-kinase (PI3K) and negatively by phosphatase and tensin homologue (PTEN), a tumour suppressor gene product. Therefore, loss of PTEN expression, via a deletion on chromosome 10, leads to uncontrolled phosphate transfer and activation of Akt, which is commonly observed in NSCLC patients with EGFR TKI resistance. [7,26] On the other hand, a PI3K catalytic alpha (PIK3CA) oncogene mutation is also observed in a small minority of advanced NSCLC patients. [27] This mutation enhances the positive regulation of the pathway via PI3K, thereby leading to heightened activation of Akt. As it is noted that PIK3CA mutations are commonly found in treatment naive lung adenocarcinoma [6] with concurrent driver mutations in EGFR, KRAS or BRAF, PIK3CA mutation is likely to be a secondary, acquired mutation contributing to resistance. [28] By targeting these mechanisms, a patient’s response to EGFR TKIs can potentially be restored.

Insulin-like growth factor 1 Receptor – Parallel EGFR independent pathway

Like EGFR, Insulin-like growth factor 1 receptor (IGF-1R) is a tyrosine kinase that can trigger similar downstream signaling events. Blockade of EGFR pathways with TKI administration has led to compensatory or adaptive upregulation of downstream signaling via the IGF-1R pathway which eventually leads to sustained activation of the PI3K/Akt/mTOR pathway. [29] Gefitinib-resistant cancer cells are also found to have reduced expression of IGF binding proteins, [8] which modulates the activity of IGF-1R by binding to IGF ligands such as IGF-1 and IGF-2. Loss of these binding proteins leads to higher levels of IGF-1 and IGF-2, which increases constitutive activation of the IGF-1R tyrosine kinase and its downstream targets.

Figure 2. PI3K/Akt/mTOR pathway.

MET pathway amplification

EGFR is an important member of a class of four ErbB receptor tyrosine kinases – EGFR/HER1/ErbB1, HER2/ErbB2, HER3/ErbB3 and HER4/ErbB4. Dimerization of any two of this class of receptors (homodimerization or heterodimerization) will lead to phosphorylation and eventual downstream signal cascade. MET (Mesenchymal- Epithelial Transition) is a receptor tyrosine kinase that binds to hepatocyte growth factor (HGF) and is found to undergo amplification in the presence of TKIs. The extensive crosstalk between the HGF/ MET pathway and the PI3K/Akt/mTOR pathway strongly reactivates downstream signals through HER3/ErbB3 phosphorylation, resulting in similar downstream events as EGFR phosphorylation, despite TKI administration. [6,9,18,30] Another interesting observation is that both MET and EGFR have loci on chromosome 7 and EGFR mutation positive NSCLC patients commonly have polysomy of chromosome 7. [19,31] This could be a contributing factor to the presence of intrinsic resistance to EGFR TKIs as targeting EGFRs does not negate the effect of co-existing MET amplification on the PI3K/Akt pathway.

Figure 3. MET amplification.

Others

The vascular endothelial growth factor (VEGF) pathway, which plays a key role in angiogenesis, is another signaling pathway that can be targeted. This is based on the principle that multiple oncogenic targets can contribute to the malignant phenotype. By targeting multiple oncogenic targets, such as inhibition of both EGFR and VEGF, it is hoped that this would circumvent development of resistance to EGFR TKIs, maintaining treatment efficacy. [32]

Sequist et al. observed that a histological transformation from NSCLC to small cell lung cancer (SCLC) can occur with TKI treatment. [33] This was found in 14% of EGFR-expressing NSCLC patients who have acquired EGFR TKI resistance. The significance of this is that the histological transformation has now given the patient a chance of a good response with standard SCLC chemotherapy regimens. More investigations regarding this are necessary to understand the mechanism of the transformation as it can potentially be a novel strategy for the treatment of NSCLC patients.

Novel Therapies being investigated to overcome EGFR TKI resistance

2nd Generation Irreversible Tyrosine Kinase Inhibitors

Through understanding how the T790M mutation changes binding of first generation TKIs to EGFR, second generation irreversible TKIs have been developed and are being investigated in various trials. These second generation TKIs such as neratinib and afatinib bind irreversibly to the ATP binding site of EGFR via the formation of a covalent bond. They have been shown to be able to overcome T790M driven acquired resistance. [6,34,35] Also, these TKIs can target not only EGFR/HER1 tyrosine kinase receptors, but also other members of the same class that potentiate similar downstream signaling. For example, afatinib targets EGFR/ErbB1 and ErbB2 tyrosine kinase receptors. [35] Dacomitinib is shown to be a pan-HER TKI, targeting all members of the same class, and is found to be effective against tumours harbouring T790M mutations, however, phase III trials have yet to be completed. [20,36] There are also concerns regarding the higher toxicity profile of these drugs with a narrower therapeutic window. Work on third generation EGFR TKIs are also in progress, binding covalently to the ATP site of mutant EGFR with particular specificity to the T790M mutant. [6,37]

Specific T790M inhibitors

A new class of drug that specifically targets and inhibits the T790M mutant has also been developed. [38] It is thought that targeting cancer cells which have the mutation would spare cells without the mutation and therefore remain susceptible to TKIs. Hence, mutated cancer cells with acquired resistance to TKIs can now be targeted, and the efficacy of TKIs on TKI-susceptible cancer cells is maintained.

Altering the PI3K/Akt/mTOR pathway

There is great promise in creating drugs to target this pathway as we know that levels of molecules involved in signal transduction are tightly regulated by multiple factors via many interactions. However, because this pathway is present in both cancer cells and many normal cells as well, there are concerns that drugs which alter its activity would result in pharmacological toxicities. PI3K (LY294002) and Akt inhibitors are currently being studied both as a monotherapy and as a concurrent treatment with EGFR TKIs. [39]

Another drug that has been used with great experience as an immunosuppressive agent, everolimus, is being studied for its effect on advanced NSCLC. [40] Another PI3K/mTOR inhibitor, XL765, is currently undergoing early phase trials against erlotinib alone and in combination with erlotinib. [41]

MET receptor – inhibiting amplification

Observation of the crosstalk between the HGF/MET and PI3K/AKT/ mTOR pathways has led to the hypothesis that co-administration of MET inhibitors can restore sensitivity to EGFR TKIs in resistant tumours displaying MET amplification. [42,43] In a phase II randomized trial, progression free survival (PFS) was higher when erlotinib was given with tivantinib (an agent targeting the MET receptor) as compared to erlotinib given with placebo. [44] Although this finding was not statistically significant, phase III trials are currently ongoing to explore its efficacy and related toxicities. [45]

Onartuzumab, an anti-MET receptor monoclonal antibody has shown increased PFS and overall survival when given with Erlotinib as compared to placebo. [46]

A phase I study of cabozantinib (XL184), a drug which targets both VEGF and MET receptors, has shown promise after preliminary analysis. [9]

Others

Multiple targets with great potential are currently being investigated. Blockade of IGF-1R receptors with antibodies or molecular substrates can potentially alter downstream signaling that promotes cancer growth. [29] This can also be achieved by administration of recombinant IGF binding proteins to reduce circulating levels of IGF-1R ligands. Inhibition of the nuclear factor κB pathway is also of particular interest.

Different approaches to the treatment of EGFR positive NSCLC patients

Sensitizers

With the observation of histological transformation as a mechanism of acquired resistance to overcome EGFR inhibition, [37] it is hypothesized that under the therapeutic stress of EGFR TKIs, the cancer cells can be encouraged to adopt this resistance mechanism and transform from a NSCLC to SCLC. Administration of EGFR TKIs can then ‘sensitize’ the cancer cells to be susceptible to platinum and etoposide based chemotherapy (standard regimen for SCLC), that would otherwise be ineffective for NSCLC.

Alternating Treatment/Different Dosing

A review by Oxnard [37] has found that although some cancer cells can acquire the T790M mutation in the presence of a EGFR TKI, this mutation becomes undetectable after a period of discontinued EGFR TKI therapy. It is explained that the T790M mutation causes suboptimal growth profile in the absence of EGFR TKIs and therefore through the notion of ‘survival of the fittest’, they are removed from the cancer population when EGFR TKIs are discontinued. This dynamic change in cancer cell profile now allows the cancer to once again be susceptible to EGFR TKI treatment. Thus, there is a biological rationale to create a dosing schedule with intervals of EGFR TKI treatment and intervals without. This would hopefully maximize cancer cell kill and improve patient outcomes.

Combination/Polytherapy

There is a lot of potential in targeting specific parts of the complex signaling network in cancer treatment, but this runs the risk of the development of acquired resistance via compensatory pathways. Therefore, a different approach of combining multiple drugs targeting different receptors and different parts of the signaling pathway at the same time may provide a synergistic effect in limiting cancer cell growth. This can be achieved with various classes of drugs such as TKIs, downstream signal molecule inhibitors, monoclonal antibodies targeting receptors involved, immunosuppresants such as everolimus and even chemotherapy. However, trials do require adequate time, participants and investments. More effort and investigation must be performed before the best combination can be identified.

Selection of Patients

Demographically, it has been found in many articles that patients who are most likely to respond to EGFR TKIs are of Asian background (mainly Japanese), female, never-smokers and have NSCLC of the adenocarcinoma histology. [6,8,19,20,39] Presence of mutant KRAS is also found to be a strong predictor of lack of response to EGFR TKIs in NSCLC patients. [6,47,48] It is also discovered that low expression of nuclear factor κB inhibitor was predictive of poor clinical outcome for patients receiving erlotinib without a T790M mutation, indicating its potential in predicting response to EGFR TKI therapy. [18] PTEN inactivation is also a predictor of resistance to EGFR-family antagonists, implying that this subset of patients would not be amenable to long term EGFR TKI therapy. [39] These predictors not only enable us to select patients who are more likely to benefit from EGFR TKI therapy, but also help to prevent exposure of unnecessary toxicities to poor responders. With further validation of these predictors through studies, it might be even possible to develop a nomogram or scoring system to predict the success of EGFR TKIs in NSCLC patients.

Future Directions

As investigative techniques such as genotypic assessments, new assays, cell lineage tracing, chemical genomic profiling studies, next generation sequencing and proteomics develop, more information regarding tumorigenesis will be revealed. Ongoing research in other cancers may also provide insight to the pathogenesis of NSCLC. As more drugs are being released for clinical use, further research must be done to determine the short and long term side effect profiles of these drugs, whether used on their own or in combination. The fundamental principles of beneficence and non-maleficence should not be forgotten. No matter how novel or promising a drug can prove to be, its value for clinical application becomes limited when its toxicity profile causes more harm than good to patients.

It is also interesting to note that tumour signaling profiles are in a dynamic rather than static state. Mutations can be gained and lost, depending on patient’s biology, genetics and treatment received. This could mean that gathering information regarding the cancer may have to be a continuous activity rather than just prior to treatment. Patients may have to be regularly biopsied at different stages of chemotherapy or EGFR TKI treatment.

Knowing that every patient with NSCLC can have subtle differences in the biology of the cancer, future research may warrant the need to create a tumour bank where cancer cells are profiled and sequenced, both before and after treatment. This information will then be stored in a database where researchers can retrieve information from, and possibly access cell samples if required.

With the development of deep analytic systems such as the IBM supercomputer Watson, who is ‘learning’ about lung cancer at the Memorial Sloane-Kettering Cancer Centre, information from the tumour bank can be rapidly processed to generate meaningful data. Such information sharing will require an international effort, enhancing the development of targeted, higher-powered and multi-centred trials. This can drive down the high costs of drug discovery, reducing wastage of precious resources into unfruitful studies that seek to answer poorly formulated clinical questions.

Conclusion

The idealistic imagination of cancer cure will come in the form of personalized medicine where cancer cells are analyzed through a machine which puts together a concoction of molecules to create a single, simple tablet that will destroy the tumour entirely without side effects. As research becomes more focused into the little details of each signaling molecule in every pathway, the cumulative understanding of cancer will be heightened tremendously. The content and amount of research done is no doubt exciting and promising, but, as a clinician, our focus remains ultimately on the patient and not merely on the cancer.

Conflict of interest

None declared.

Correspondence

B Chua: bjchu2@student.monash.edu

References

References
[1] Breccia M, Alimena G. Resistance to imatinib in chronic myeloid leukemia and therapeutic approaches to circumvent the problem. Cardiovascular & hematological disorders drug targets. 2009 Mar;9(1):21-8. PubMed PMID: 19275574. Epub 2009/03/12. eng.

[2] Druker BJ, Guilhot F, O’Brien SG, Gathmann I, Kantarjian H, Gattermann N, et al. Five-year follow-up of patients receiving imatinib for chronic myeloid leukemia. The New England journal of medicine. 2006 Dec 7;355(23):2408-17. PubMed PMID: 17151364. Epub 2006/12/08. eng.

[3] The Nobel Foundation. The Nobel Prize in Physiology or Medicine 1986 – Award Ceremony Speech [Internet]. Stockholm, Sweden: Nobel Media AB; 1986 [cited 2013 18 August]. Available from: http://www.nobelprize.org/nobel_prizes/medicine/ laureates/1986/presentation-speech.html.

[4] U.S. Food and Drug Administration. Erlotinib [Internet]. Silver Spring, U.S.: U.S. Department of Health and Human Services; 2010 [updated 19 April 2010; cited 2013 18 August]. Available from: http://www.fda.gov/AboutFDA/CentersOffices/ OfficeofMedicalProductsandTobacco/CDER/ucm209058.htm.

[5] U.S. Food and Drug Administration. Questions and Answers on Iressa (gefitinib) [Internet]. Silver Spring, U.S.: U.S. Department of Health and Human Services; 2005 [updated 26 June 2013; cited 2013 18 August]. Available from: http://www.fda.gov/Drugs/ DrugSafety/PostmarketDrugSafetyInformationforPatientsandProviders/ucm110476.htm.

[6] Galvani E, Alfieri R, Giovannetti E, Cavazzoni A, La Monica S, Galetti M, et al. Epidermal growth factor receptor tyrosine kinase inhibitors: current status and future perspectives in the development of novel irreversible inhibitors for the treatment of mutant non-small cell lung cancer. Current pharmaceutical design. 2013;19(5):818-32.

[7] Chen Y-J. Mechanisms underlying resistance to epidermal growth factor receptor inhibitors in non-small cell lung cancer. Biological and Biomedical Reports. 2012;2(3):141-8.

[8] Wheeler DL, Dunn EF, Harari PM. Understanding resistance to EGFR inhibitors-impact on future treatment strategies. Nature Reviews Clinical Oncology. 2010;7(9):493-507.

[9] Dienstmann R, De Dosso S, Felip E, Tabernero J. Drug development to overcome resistance to EGFR inhibitors in lung and colorectal cancer. Molecular Oncology. 2012;6(1):15-26.

[10] Antonicelli A, Cafarotti S, Indini A, Galli A, Russo A, Cesario A, et al. EGFR-targeted therapy for non-small cell lung cancer: focus on EGFR oncogenic mutation. International journal of medical sciences. 2013;10(3):320-30.

[11] Mitsudomi T, Morita S, Yatabe Y, Negoro S, Okamoto I, Tsurutani J, et al. Gefitinib versus cisplatin plus docetaxel in patients with non-small-cell lung cancer harbouring mutations of the epidermal growth factor receptor (WJTOG3405): an open label, randomised phase 3 trial. The lancet oncology. 2010 Feb;11(2):121-8. PubMed PMID: 20022809. Epub 2009/12/22. eng.

[12] Maemondo M, Inoue A, Kobayashi K, Sugawara S, Oizumi S, Isobe H, et al. Gefitinib or Chemotherapy for Non–Small-Cell Lung Cancer with Mutated EGFR. New England Journal of Medicine. 2010;362(25):2380-8. PubMed PMID: 20573926.

[13] Mok TS, Wu Y-L, Thongprasert S, Yang C-H, Chu D-T, Saijo N, et al. Gefitinib or Carboplatin–Paclitaxel in Pulmonary Adenocarcinoma. New England Journal of Medicine. 2009;361(10):947-57. PubMed PMID: 19692680.

[14] Cancer Australia – Australian Government. Lung Cancer Statistics [Internet]. New South Wales: Cancer Australia; 2013 [updated 2 April 2013; cited 2013 18 August]. Available from: http://canceraustralia.gov.au/affected-cancer/cancer-types/lung-cancer/lung-cancer-statistics.

[15] Cancer Australia – Australian Government. Lung Cancer [Internet]. New South Wales: Cancer Australia; 2013 [updated 2 August 2013; cited 2013 18 August]. Available from: http://canceraustralia.gov.au/affected-cancer/cancer-types/lung-cancer.

[16] Cancer Council Australia Lung Cancer Guidelines Working Party. Clinical Practice Guidelines for the treatment of lung cancer [Internet]. New South Wales Cancer Australia; 2012 [updated 30 Jan 2014; cited 2014 3 Jun 2014]. Available from: http://canceraustralia. gov.au/about-us/news/new-clinical-guidelines-lung-cancer-treatment.

[17] Jackman D, Pao W, Riely G, Engelman J, Kris M, Jänne P, et al. Clinical definition of acquired resistance to epidermal growth factor receptor tyrosine kinase inhibitors in non-small-cell lung cancer. Journal of clinical oncology. 2010;28(2):357-60.

[18] Lin L, Bivona TG. Mechanisms of Resistance to Epidermal Growth Factor Receptor Inhibitors and Novel Therapeutic Strategies to Overcome Resistance in NSCLC Patients. Chemotherapy Research and Practice. 2012;2012:9.

[19] Barton S, Starling N, Swanton C. Predictive molecular markers of response to epidermal growth factor receptor(EGFR) family-targeted therapies. Current cancer drug targets. 2010;10(8):799-812.

[20] Brzezniak C, Carter C, Giaccone G. Dacomitinib, a new therapy for the treatment of non-small cell lung cancer. Expert opinion on pharmacotherapy. 2013;14(2):247-53.

[21] Yun CH, Mengwasser KE, Toms AV, Woo MS, Greulich H, Wong KK, et al. The T790M mutation in EGFR kinase causes drug resistance by increasing the affinity for ATP. Proceedings of the National Academy of Sciences of the United States of America. 2008 Feb 12;105(6):2070-5. PubMed PMID: 18227510. Pubmed Central PMCID: PMC2538882. Epub 2008/01/30. eng.

[22] Bell DW, Gore I, Okimoto RA, Godin-Heymann N, Sordella R, Mulloy R, et al. Inherited susceptibility to lung cancer may be associated with the T790M drug resistance mutation in EGFR. Nature genetics. 2005 Dec;37(12):1315-6. PubMed PMID: 16258541. Epub 2005/11/01. eng.

[23] Vikis H, Sato M, James M, Wang D, Wang Y, Wang M, et al. EGFR-T790M is a rare lung cancer susceptibility allele with enhanced kinase activity. Cancer research. 2007;67(10):4665-70.

[24] Bussink J, van der Kogel AJ, Kaanders JHAM. Activation of the PI3-K/AKT pathway and implications for radioresistance mechanisms in head and neck cancer. Lancet oncology. 2008;9(3):288-96.

[25] Huang W-C, Hung M-C. Induction of Akt activity by chemotherapy confers acquired resistance. Journal of the Formosan Medical Association. 2009;108(3):180-94.

[26] Sos M, Koker M, Weir B, Heynck S, Rabinovsky R, Zander T, et al. PTEN loss contributes to erlotinib resistance in EGFR-mutant lung cancer by activation of Akt and EGFR. Cancer research. 2009;69(8):3256-61.

[27] Raimondi C, Falasca M. Targeting PDK1 in cancer. Current medicinal chemistry. 2011;18(18):2763-9.

[28] Chaft J, Arcila M, Paik P, Lau C, Riely G, Pietanza MC, et al. Coexistence of PIK3CA and other oncogene mutations in lung adenocarcinoma-rationale for