Introduction: Hip muscle weakness has been shown to be associated with lower limb pain and (re)injury. A reliable means of assessing hip muscle strength is required to assist sports physicians, orthopaedic surgeons, and physiotherapists in assessing injury risk and applying preventative measures such as appropriately prescribed and monitored exercise intervention. This study aimed to determine the relative and absolute test-retest reliability of a testing procedure assessing the isometric strength of hip flexors, extensors, abductors, adductors, internal rotators, and external rotators using handheld dynamometry.
Methods: 10 healthy subjects with an average age of 25.5 years (± SD 6.0 years) had the isometric strength of their six hip muscle groups measured by one tester using a handheld dynamometer. Subjects were tested on two separate occasions with an average interval of 5.7 days. Intra-class correlation coefficients (ICC) and the standard error of measurement (SEM) were used as measures of relative and absolute reliability respectively.
Results: All six hip muscle groups demonstrated ‘excellent’ test-retest relative reliability (ICC 0.86–0.97). Absolute reliability ranged from 3.3–7% and 0.03–0.13 Nm/kg as a measure of unit strength.
Discussion: This protocol demonstrates excellent test-retest reliability for analysis of the isometric strength of all six hip muscle groups using a handheld dynamometer. This protocol serves as an important reference for clinical assessment of hip muscle function.
Introduction
 Adequate hip muscle strength is required to control the alignment of the lower limb and therefore limit exposure of distal structures to potentially damaging forces. [1] Deficits in hip muscle strength have demonstrated an association with pain and (re)injury in the hip, [2,3] knee, [4,5] and ankle. [6] Consistent with these observations, strengthening of hip muscles through exercise interventions has been shown to reduce lower limb pain and injury, [7,8] improve lower limb landing alignment, and minimise potentially injurious positions. [9] Given this well established link between hip muscle strength impairment, pain, and (re)injury; a reliable, clinically applicable means of measuring hip muscle function is necessary to assist clinicians in the development and monitoring of interventions aimed at minimising pain and (re)injury, and improving patient function.
In the clinical setting, strength is conventionally assessed using manual muscle testing (MMT). MMT provides only a rated score (ranging from zero to five) of strength [10] and relies on clinical judgement of strength relative to the contralateral limb and/or previous strength testing experiences. A more quantitatively accurate measure of muscle strength can be obtained using dynamometry. Dynamometry measures the force produced on a maximum voluntary contraction and in contrast to MMT it provides an objective unit measure of strength. Many laboratory dynamometry stations used previously [11,12] have poor clinical utility as they are expensive and lack easy portability. In contrast, handheld dynamometry is an inexpensive and portable means of measuring strength amenable to clinical use.
Reliability is also an important component of clinical utility. Relative and absolute reliability have been identified as two distinct measures. [13] Relative reliability assesses the level of agreement between values. [14] It provides information about the association between test-retest data but not the proximity of the values. [13] Absolute reliability measures the variability between test-retest data, with less variability representing greater reliability. [13] A number of studies have assessed the reliability of handheld dynamometry on hip muscle strength testing. [7,15-20] A small number have established reliability using a handheld device for all six hip muscle groups. [2,21,22] These studies have included strength testing positions where the tester is required to stabilise the subject or hold the non-test limb during testing, leaving only one arm available to counteract the force produced by the hip muscles. Given the magnitude of force produced by the hip muscles [18] and that reliability is affected by the tester’s ability to apply sufficient counteracting force, [23] it is important that for a reliable strength testing procedure, positions are chosen to facilitate stability for not only the subject but also the tester.
There is no single, universally accepted testing protocol for all six hip muscle groups. Previous investigations have included testing positions that have required the tester to stabilise the subject. More stable testing positions are required to account for the magnitude of force produced by the hip musculature. The purpose of this pilot study was to therefore assist in establishing the test-retest relative and absolute reliability of a strength testing protocol for hip flexion, extension, abduction, adduction, internal rotation, and external rotation using handheld dynamometry.
Methods
Subjects
Approval for this study was obtained through the University of South Australia Human Research Ethics Committee. Five healthy male and five healthy female subjects were recruited via a convenience sample through an Adelaide Physiotherapy and Sports Medicine clinic. The means and standard deviations of height (1.72m ± 0.09m), mass (71.7 ± 9.9kg), and age (25.5 ± 6.0 years) were established. Subjects were included if they had no history of pain or clicking/clunking sensations from either hip joint. Subjects were excluded if they reported pain during the strength assessment period that would limit the production of a maximum voluntary contraction. Furthermore, to limit error in the measures that may be due to strength gains from exercise training, subjects were excluded if they were participating in regular lower limb strengthening exercises. Strength was assessed by the same tester on two separate occasions with an average test-retest interval of 5.7 days (range 5–7 days). All subjects were graded as performing at a ‘sufficient’ level of physical activity measured using the Active Australia Survey. [24]
Strength Assessment
Strength of the six hip muscle groups was measured using a Nicholas handheld dynamometer (HHD) (Lafayette Instruments, Lafayette, IN, USA). Strength data was recorded in kilograms (kg) and then converted to torque values with the force in Newtons (N) (where 1kg = 9.81N) multiplied by the action length in metres (m), giving a unit of Newton-metres (Nm). The action length is the perpendicular distance from the axis of rotation to the line of force (i.e. the placement point of the dynamometer). The action length for flexion, extension, abduction, and adduction was measured as the distance from the greater trochanter of the femur to the lateral femoral epicondyle, and for rotation from the lateral femoral condyle to the base of the lateral malleolus. Each action length was recorded as the average of two measures for each measured action length based on the protocol for measuring limb length validated by Beattie and colleagues. [25] To account for the confounding effect of body size on strength, [26] data was normalised to body mass, which was measured in kilograms (kg) using the same scales (Hanson, Croissy-sur-Seine, France) for each subject.
Subjects were tested on the same height adjustable plinth. Strength was assessed using the ‘make’ test where the subject’s isometric muscle action is matched by the tester. [17] To ensure the dynamometer force plate was maintained in a perpendicular position relative to the test limb, the tester’s arm was positioned with elbows locked in extension. Pillows were used as required to achieve and maintain subject positions with the hip joint in a neutral orientation in reference to adduction, abduction, internal rotation, and external rotation for all positions (Figure 1). Participants were given instructions including a description and passive demonstration of the action required, the movements to avoid, and the instruction to “push as hard as you can”. They were asked to give one sub-maximal contraction of 50 percent effort, followed by three tests of maximal effort (consistent with previous methodologies used [15]) separated by a 5 second rest. Tests were initiated and ceased with a single beep and not the tester’s verbal commands. Given that isometric muscle strength has been shown to be influenced by motivational states, [27] this method was employed to limit the tester’s influence over the subject’s performance through varying volume or verbal inflections that can differentially affect subject effort. Therefore no encouragement was offered during tests. The strongest of the tests was recorded. If the last test produced the strongest result the subject was retested to ensure improvements in strength were not a result of habituation and the subject’s best effort or maximum had been achieved. Subjects were retested if they reported failure to achieve maximum effort, or if stabilisation of the device and/or subject during testing was inadequate. The dynamometer limited tests to five seconds, to allow enough time for the generation of maximum tension. [17] The maximum force produced within the five second test period was recorded by the dynamometer. Because several muscles within the hip contribute to more than one hip joint movement, the order of strength assessment was randomised between participants. The tester was blind to strength data from the first test session until retest data was gathered.
Subject Positioning
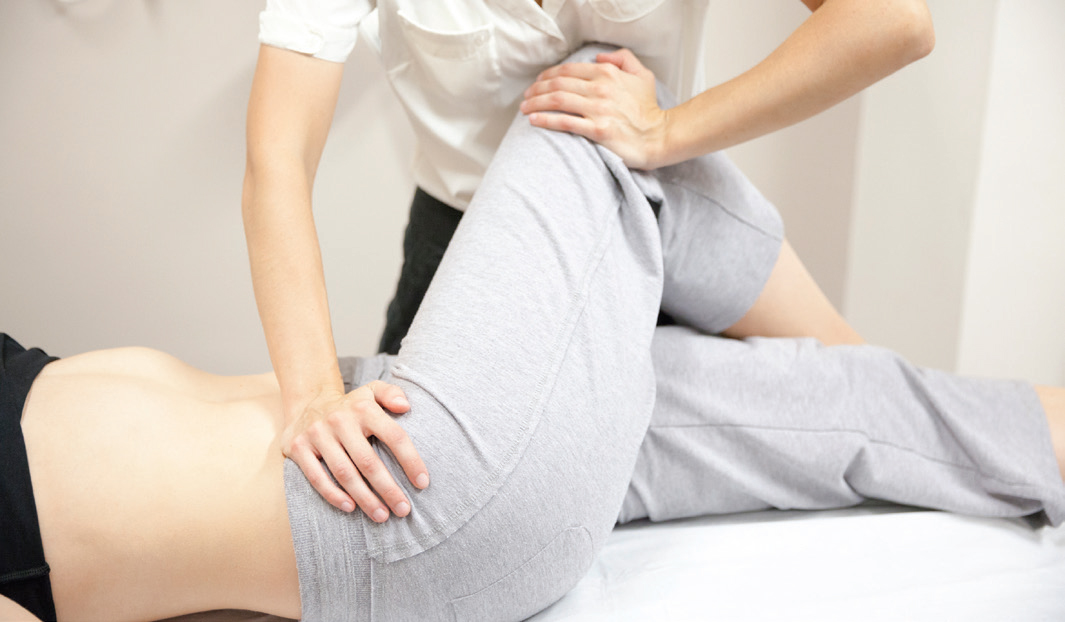
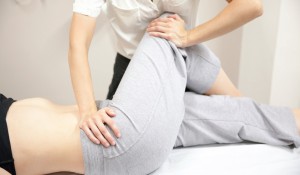
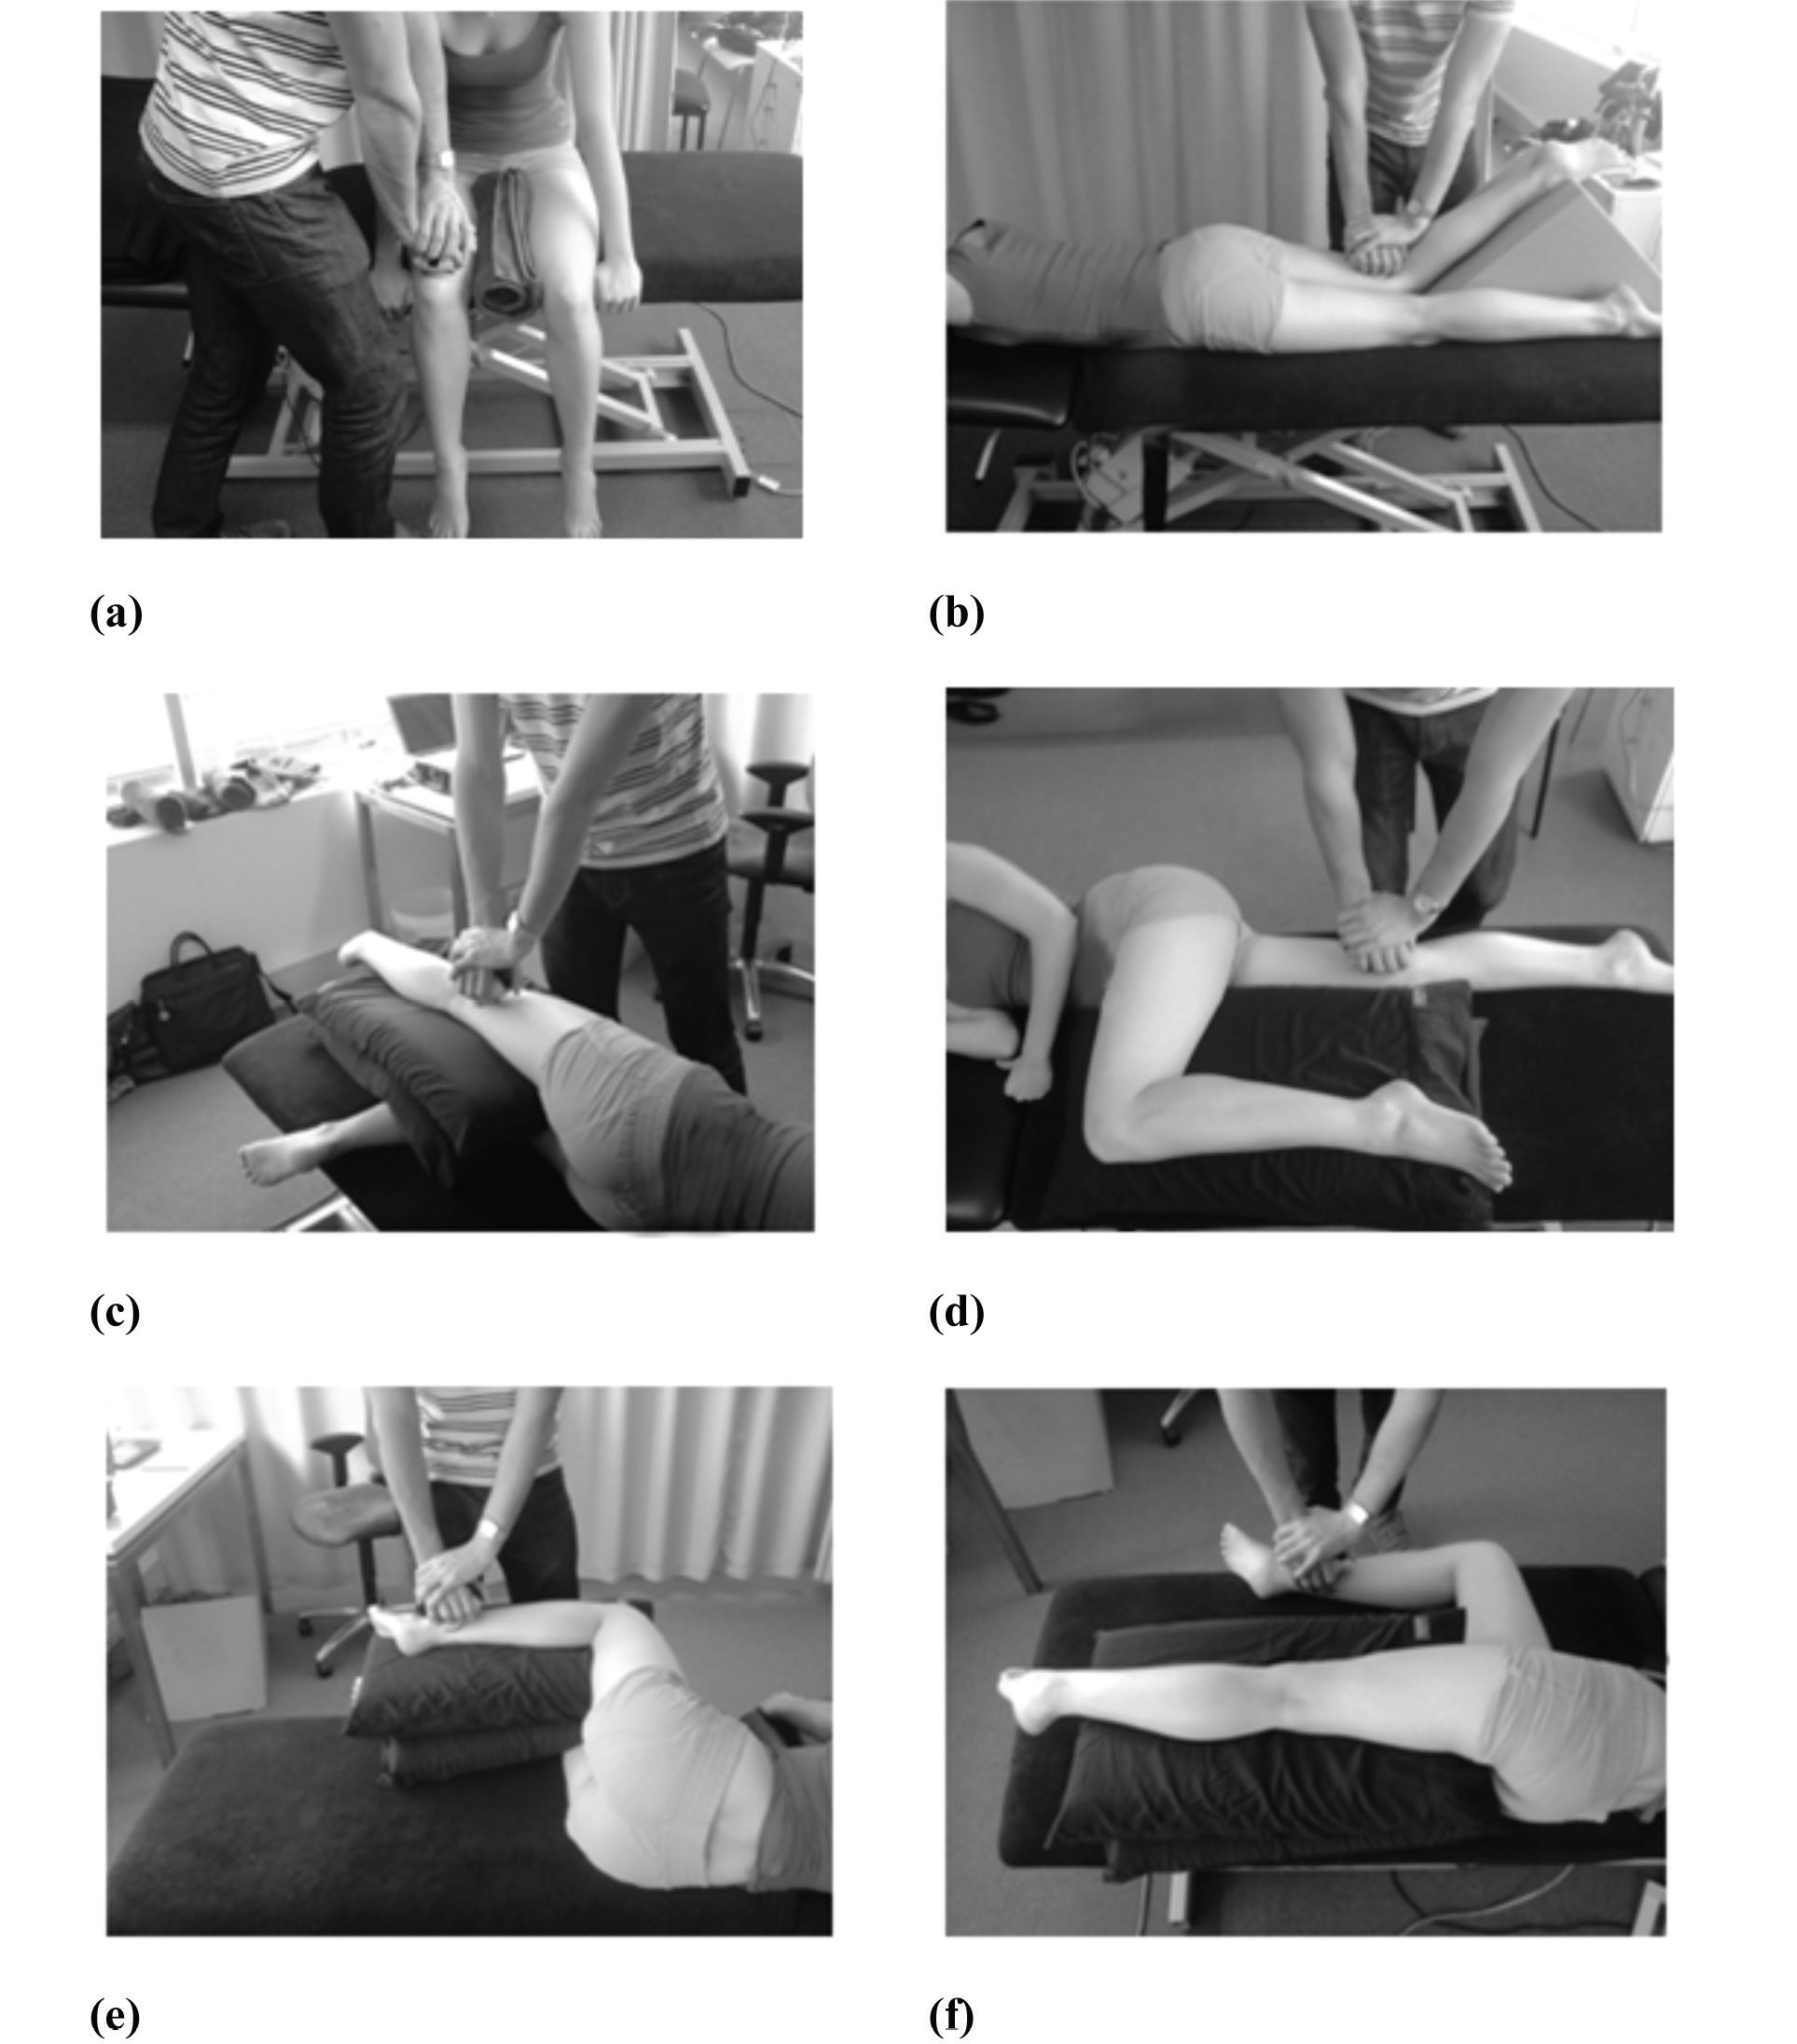
Hip flexion was measured in sitting, with the hip and knee flexed to 90o (Figure 1a). The plinth height was standardised for each subject as the height of two fingers between the plantar-flexed foot and the floor, hence feet were not in contact with the ground, eliminating compensation by calf muscles. For the remaining muscle groups the plinth was adjusted to be as low as possible. The HHD was positioned on the surface of the skin immediately proximal to the superior pole of the patella (as shown previously [15]). Hip extension was measured in prone with the hips in neutral (Figure 1b) and legs supported by a foam wedge. The dynamometer was placed on the surface of the skin of the posterior thigh two centimetres proximal to the femoral epicondyles. [21,28] Participants were instructed to lift their thigh from the table without bending or straightening their knees, or pushing their shin into the foam wedge. Hip abduction and adduction were measured in side lying (Figure 1c, d). The subject was instructed to lift their test limb into the air while keeping their pelvis and knees straight and not to rotate their thigh in or out. The dynamometer was placed immediately superior to the lateral (abduction) and medial (adduction) femoral epicondyles. [21] Internal rotation and external rotation were assessed in side lying with the subject instructed to rotate their thigh by lifting the ankle of their test limb into the air (Figure 1e, f). The dynamometer was placed two centimetres proximal to the lateral (internal rotation) and medial (external rotation) malleoli. [21]
Data Analysis
Histograms and values of skewness demonstrated all data to be distributed normally. Bland-Altman plots were used to determine if there was a relationship between magnitude and measurement error (heteroscedasticity) present within the data. [29] Paired t-tests were used to determine the presence of systematic bias. [29] A probability level of 5% (p < 0.05) was assumed to be significant. Relative reliability was established via intra-class correlation coefficients (model 2,1) (ICC) and were interpreted as excellent (> 0.75), fair to good (0.40 to 0.75), or poor (< 0.40) according to classifications by Shrout and Fleiss. [30] Absolute reliability was assessed using the standard error of measurement (SEM) and was calculated by the equation: [SEM = SD x √(1 – ICC)], where SD is the standard deviation of the strength data from all subjects for each muscle group. [14] The SEM was presented as a unit of strength (Nm/kg) and as a percentage of the average of test and retest means of each muscle group as per previous methods. [22] A threshold beyond which a true change in strength is said to have occurred was determined for each muscle group. This is termed the minimum detectable change (MDC) and was calculated by multiplying the SEM by the square root of 2 (to account for error associated with repeated measures) and the z-score of 1.64 to establish a 90% confidence interval. [16] This confidence interval was dictated by the sample size. All data was analysed using SPSS for Windows 17.0 (SPSS, SPSS Inc., Chicago, IL, USA).
Results
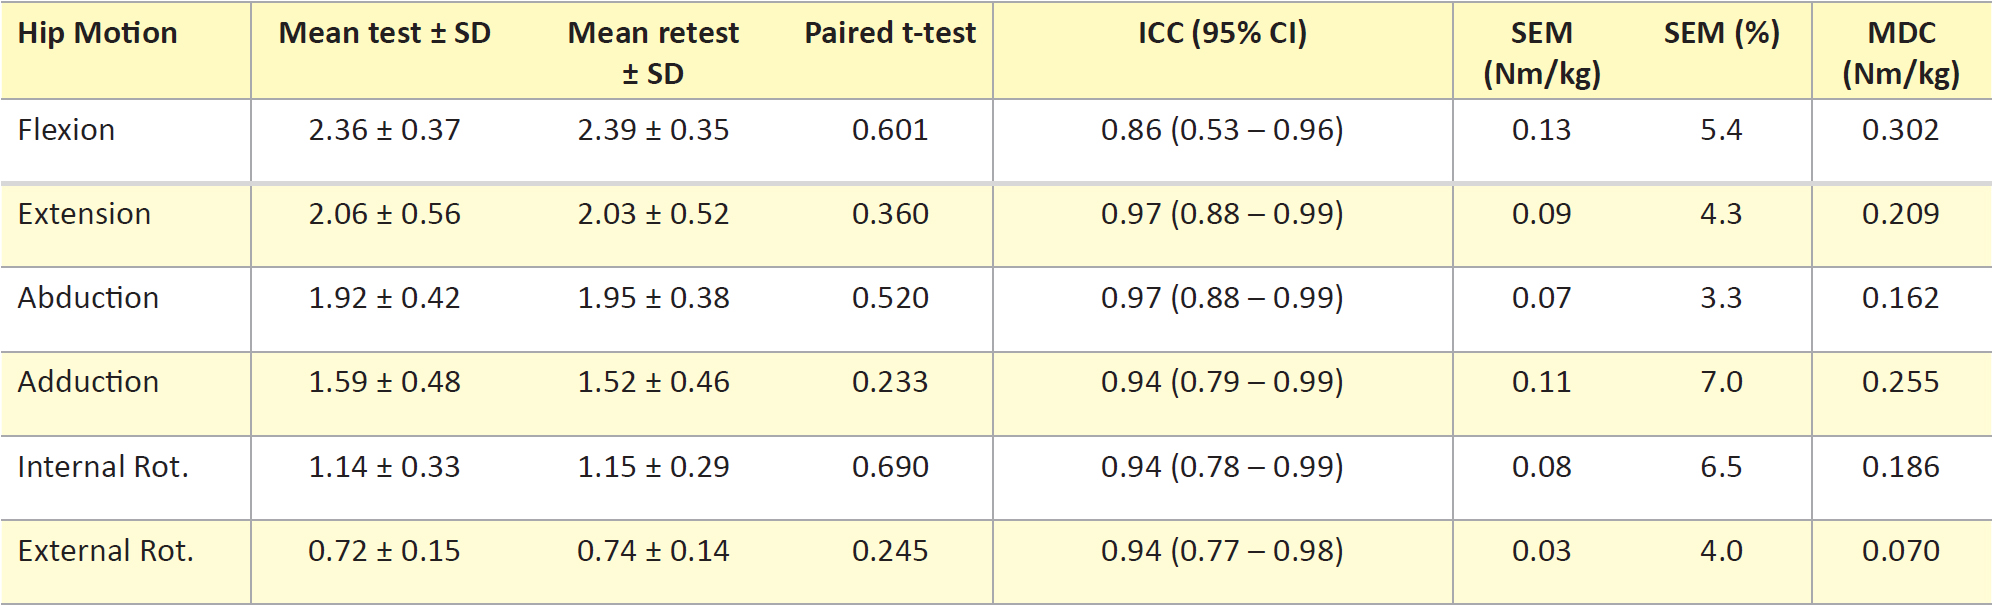
Paired t-tests showed no differences (p > 0.05) between repeated measures for all muscle groups. Bland-Altman plots showed no heteroscedasticity present within the data. ICC values, as a measure of relative reliability, ranged from 0.86 – 0.97 (Table 1), which is classified as ‘excellent’ reliability by Shrout and Fleiss. [30] The lower boundary of the 95% confidence interval fell below this classification for hip flexion only (Table 1). As a measure of absolute reliability, the SEM represented as a unit of strength ranged from 0.03 Nm/kg to 0.13 Nm/kg and as a percentage from 3.3% to 7% (Table 1). MDC data ranged from 0.070 Nm/kg to 0.302 Nm/kg (Table 1) and represented the minimum change required in subsequent testing to reason with 90% confidence that a true change in strength has occurred and that differences are not a result of measurement error.
Discussion
This study contributes to the establishment of a reliable isometric strength testing protocol for hip flexion, extension, abduction, adduction, internal rotation, and external rotation using handheld dynamometry. This protocol serves as an important reference for clinical assessment of hip muscle function. Both relative and absolute test-retest reliability were assessed, giving insight into both the level of agreement and variability between repeated measures. Overall, findings were consistent with analysis of the present study’s raw force data, indicating that the measurement of action length and body mass did not affect reliability. Relative reliability was examined using intra-class correlation coefficients. This method differs from previous studies, which calculated the level of agreement via Pearson’s correlation coefficient, [2,21] a measure designed to assess the relationship between two variables rather than the same variable tested twice. [31]‘Excellent’ relative reliability [30] was demonstrated for the strength testing procedure for all six hip muscle groups (Table 1). This classification is comparable with analyses of the less clinically applicable ‘gold standard’ [32] laboratory dynamometry stations [11,28] and hand-held dynamometry investigations that assessed reliability from data gathered in the same test session, [21] where reliability may be overstated because the variable of subject setup is not tested twice. The use of two test occasions may leave the present study more exposed to systematic error. However, the absence of such error is supported by paired t-tests (p > 0.05) and normally distributed data. Absolute reliability was examined using the SEM. During repeated measures, some variability will be observed even if there is no reason to suspect a change in strength parameters. Given the SEM assumes an absence of heteroscedasticity, Bland-Altman plots were necessary as ratio data, such as that of the present study, is susceptible to an increase in measurement error as the measured value increases. [29]
The adductors had the largest SEM (7%); however, their ICC value indicated good agreement (0.94). The standard deviation observed in test and retest adduction means is consistent with heterogeneity that, where present, will inflate the ICC value. [13] The level of error demonstrated here by the SEM may be explained by the sensitivity of the area of the thigh where the HHD was placed. For subjects who consequently reported discomfort a hand towel was placed under the HHD to allow a maximum voluntary contraction. Nonetheless, this level of error is still comparable with previous investigations (7.8%) assessing hip adduction in this position, but with the HHD placed at the ankle. [22]
The hip flexors demonstrated the lowest ICC (0.86). Although these findings are in contrast to previous analyses of laboratory dynamometry (0.70–0.71), [11] the lower boundary of the ICC confidence interval (0.53) in the present study must be considered in the interpretation of this value. Given that the ability to counteract the force produced by the subject affects reliability, [18] it follows that the hip flexors, which generated the greatest torque, also demonstrated the lowest ICC. Furthermore, to prevent the subject from ‘cheating’ by the use of their calf muscles (see Methods), the plinth height was raised. As a result, the tester’s ability to position their upper body to provide sufficient counteracting force may have been compromised. As abduction and extension were tested with the plinth set as low as possible, this rationale is consistent with these muscle groups producing the next highest mean torque values, but also demonstrating the highest ICC (0.97). This ICC value is inconsistent with that demonstrated for abduction previously, [22] where the side-lying position was also adopted (ICC 0.74). Here the authors used one hand to hold the dynamometer and the other to stabilise the pelvis. While this aims to maximise subject stability, it may compromise the tester’s ability to counteract the force produced. Force being a vector, it has components of magnitude and direction. Changes in orientation of the HHD relative to the line of force of the hip motion may influence force transmission to the HHD (Figure 2). Using only one arm to hold the dynamometer may be insufficient to properly counteract both the magnitude and the direction of the force produced. Given that controlling for both these components of force is influenced by the tester, the present study chose positions that maximise not only the stability of the subject, but also that of the tester. These positions sought to permit the tester to position themselves and the HHD above and in line with the line of action of the test limb and were not dependent on the tester to stabilise the subject. Internal rotation and external rotation positions were hence also dictated by this notion with both demonstrating relative and absolute reliability comparable with previous findings supporting their use as a potential alternative to the more commonly utilised sitting position. [5,15,16,21,22]

Although this study demonstrates excellent test-retest reliability, the limitations must be acknowledged. The nature of this investigation as a pilot study dictated the sample size and while the reliability established is comparable with previous studies of larger samples (e.g. Pua et al. [16]), further analysis may be needed to investigate the lower boundary of the confidence interval of the flexion ICC. Secondly, the MDC data offer clinicians guidelines as to when ‘real’ changes in strength have occurred which will assist in interpreting and monitoring data before and after intervention. However, given this study did not assess reliability between multiple testers, MDC data is based on the assumption that the clinician uses the dynamometer reliably and they therefore have sufficient strength to match those being tested, as is assumed to be the case in the present study given the findings. Finally, the action length will not have fully represented the length from the centre of the axis of rotation. However because of the deep location of the hip joint, the greater trochanter was reasoned to be a more reliable landmark to measure from.
Conclusion
The present study’s protocol demonstrates excellent test-retest reliability, hence supporting its use as a measure of hip muscle function. Application of this measure can assist clinicians such as sports physicians, orthopaedic surgeons, and physiotherapists with clinical examination of injuries associated with hip muscle function, exercise prescription, and the monitoring of strength changes associated with intervention. Furthermore, this protocol offers a reliable means of measuring strength deficits and therefore injury risk as well as a reliable means of measuring performance at a strength-based level in sports where hip muscle function is important.
Future Directions
This study has established a reliable strength testing protocol for the assessment of strength of all six hip muscle groups. In contrast to previous methods, the protocol offers positions, which aim to maximise subject stability to allow the tester to counteract both the magnitude and direction of force produced by the hip musculature.
Acknowledgements
The authors wish to acknowledge Saunders Sports and Spinal for the use of their facilities for subject testing.
Conflicts of Interest
There are no conflicts of interest to declare.
References
[1] Lawrence R, Kernozek T, Miller E, Torry M, Reuteman P. Influence of hip external rotation strength on knee mechanics during single leg drop landings in females. Clin Biomech. 2008;23(6):806-13.
[2] Steultjens M, Dekker J, van Baar M, Oostendorp R, Bijlsma J. Muscle strength, pain and disability in patients with osteoarthritis. Clin Rehabil. 2001;15:331-41.
[3] Rasch A, Bystrom A, Dalen N, Berg H. Reduced muscle radiological density, cross-sectional area, and strenght of major hip and knee muscles in 22 patients with hip osteoarthritis. Acta Orthop. 2007;78:505-10.
[4] Ireland M, Wilson J, Ballantyne B, McClay Davis I. Hip strength in females with and without patellofemoral pain. J Orthop Sports Phys Ther. 2003;33:671-6.
[5] Cichanowski H, Schmitt J, Johnson R, Niemuth P. Hip strength in collegiate female athletes with patellofemoral pain. Med Sci Sports Exerc. 2007;39(8):1227-32.
[6] Friel K, McLean N, Myers C, Caceres M. Ipsilateral hip abductor weakness after inversion ankle sprain. J Athl Train. 2006;41(1):74-8.
[7] Fredericson M, Cookingham C, Chaudhari A, Dowdell B, Oestreicher N, Sahrmann S. Hip abductor weakness in distance runners with iliotibial band syndrome. Clin J Sport Med. 2000;10:169-75.
[8] Tyler T, Nicholas S, Campbell R, Donellan S, McHugh M. The effectiveness of a preseason exercise program to prevent adductor muscle strains in proffesional ice hockey players. Am J Sports Med. 2002;30(5):680-3.
[9] Hewett T, Stroupe A, Nance T, Noyes F. Plyometric training in female athletes: decreased impact forces and increased hamstring torques. Am J Sports Med. 1996;24(6):765-73.
[10] Kendall F, McCreary E, Provance P, Rodgers M, Romani W. Muscles: Testing and function with posture and pain. 5th ed. Philadelphia: Lippincott Williams & Wilkins; 2005.
[11] Arokoski M, Arakoski J, Haara M, Kankaanpaa M, Vesterinen M, Niemitukia L, et al. Hip muscle strength and muscle cross sectional area in men with and without hip osteoarthritis. J Rheumatol. 2002;29:2185-95.
[12] Nadler S, Malanga G, Deprince M, Stitik T, Feinberg J. The relationship between lower extremity injury, low back pain, and hip muscle strength in male and female collegiate athletes. Clin J Sport Med. 2000;10:89-97.
[13] Bruton A, Conway J, Holgate S. Reliability: what is it, and how is it measured? Physiotherapy. 2000;86(2):94-9.
[14] Weir J. Quantifying test-retest reliability using the intraclass correlation coefficient and the SEM. J Strength Cond Res. 2005;19(1):231-40.
[15] Bennell K, Hunt M, Wrigley T, Hunter D, Hinman R. The effects of hip muscle strengthening on knee load, pain and function in people with knee osteoarthritis: a protocol for a randomised, single-blind controlled trial. BMC Musculoskelet Disord. 2007;8(121):1-9.
[16] Pua YH, Wrigley T, Cowan S, Bennell K. Intrarater test-retest reliability of hip range of motion and hip muscle strength measurements in persons with hip osteoarthritis. Arch Phys Med Rehabil. 2008;89:1146-54.
[17] Andrews A, Thomas M, Bohannon R. Normative values for isometric muscle force measurements obtained with hand-held dynamometers. Phys Ther. 1996;76(3):248-59.
[18] Bohannon R. Reference values for extremity muscle strength obtained by hand-held dynamometry from adults aged 20-79 years. Arch Phys Med Rehab. 1997;78:26-32.
[19] Scott D, Bond Q, Ann SS, Nadler S. The intra and interrater reliability of hip muscle strength assessments using handheld versus portable a dynamometer anchoring system. Arch Phys Med Rehab. 2004;85:598-603.
[20] Fulcher M, Hanna C, Elley C. Reliability of handheld dynamometry in assessment of hip strength in adult male football players. J Sci Med Sport. 2010;13:80-4.
[21] Niemuth P, Johnson R, Myers M, Thieman T. Hip muscle weakness and overuse injuries in recreational runners. Clin J Sport Med. 2004;15:14-21.
[22] Thorborg K, Petersen J, Magnusson S, Holmich P. Clinical assessment of hip strength using a hand-held dynamometer is reliable. Scand J Med Sci Sports. 2010;20:493-501.
[23] Wikholm J, Bohannon R. Hand-held dynamometer measurements: tester strength makes a difference. J Orthop Sports Phys Ther. 1991;13(4):191-8.
[24] AIHW. The active Australia survey. 2003.
[25] Beattie P, Isaacson K, Riddle D, Rothstein J. Validity of derived measurements of leg length differences obtained by use of a tape measure. Phys Ther. 1990;70(3):1-8.
[26] Jaric S. Muscle strength testing: use of normalisation for body size. Sports Med. 2002;32(10):615-31.
[27] Perkins D, Wilson G, Kerr J. The effects of elevated arousal and mood on maximal strength performance in athletes. J Appl Sports Psychol. 2001;13:239-59.
[28] Nadler S, Malanga G, Solomon J, Feinberg J, Foye P, Park Y. The relationship between lower extremity injury and the hip abductor to extensor strength ratio in collegiate athletes. J Back Musculoskelet Rehabil. 2002;16:153-8.
[29] Atkinson G, Nevill A. Statistical methods for assessing measurement error (reliability in variables relevant to sports medicine. Sports Med. 1998;4:217-38.
[30] Shrout P, Fleiss J. Intraclass correlations: uses in assessing reliability. Psychol Bull. 1979;86:420-8.
[31] Yen M, Lo LH. Examining test-retest reliability: An intra-class correlation approach. Nurs Res. 2002;51(1):59-62.
[32] Martin H, Yule V, Syddall H, Dennison E, Cooper C, Sayer A. Is hand-held dynamometry useful for the measurement of quadriceps strength in older people? A comparison with the gold standard biodex dynamometry. Gerontology. 2006;52.